A 10 MWh lithium iron phosphate battery system installed in Lagos or Accra, sized at 15.3 MWh gross to deliver 10 MWh usable, costs roughly $3.2 million at $210 per kWh installed. Over 15 years, degradation adds another $1.35 million, 42 percent of the original price, to keep the system delivering what it was sized to deliver. That figure accounts for capacity augmentation, higher maintenance, and the logistics reality of operating storage in markets where replacement modules do not arrive in 48 hours. Most project financial models do not carry this number. They should.
We previously covered Battery Degradation Part 1, showing that batteries in high-temperature, high-humidity environments like Lagos and Accra degrade up to twice as fast as global benchmarks suggest. This article turns that physical reality into dollars. Using a purpose-built financial model, we trace how degradation flows through to augmentation costs, shortfall penalties, warranty recoveries, and total lifecycle spend. The goal: give developers, lenders, and investors the full cost of keeping a storage asset credible, not the installation price alone.
Executive Summary
- Degradation is a cost problem before it is a failure. Once usable energy falls below what the system was sized to deliver, the project faces a binary: pay to restore performance through augmentation, or absorb the cost of under-delivery. Both paths carry real dollar consequences.
- The hot-climate, high-logistics premium is $1.35 million on a $3.22 million installation. A 10 MWh LFP system in Lagos or Accra carries a present-value lifecycle cost of $4.57 million over 15 years (at a 15% real USD discount rate). The gap, driven by accelerated augmentation, logistics uplift, and higher O&M, is 42% of initial capex.
- Augmentation starts in Year 2. At 3.54% annual fade, the system drops below its 10 MWh service floor before the end of Year 2. Over 15 years, cumulative capacity additions reach 9.87 MWh, nearly a full second battery, spread across the entire project life.
- Doing nothing costs $793,000. Skip augmentation entirely and the system delivers 4.96 MWh usable by Year 15. Half its original commitment. At $250/MWh, the present value of that unmet service is $793k. Whether that is tolerable depends on what a shortfall actually costs the project.
- Chemistry and warranty matter more in dollars than in fade rates. LFP’s edge over NMC goes beyond 3.5% versus 6.8% annual fade. The difference compounds into a different augmentation schedule and a lower lifecycle cost. But warranties are a ceiling, not a floor: the model credits $84k in Year 10 at 75% remedy coverage, yet most deployments in high-temperature markets will recover less if operating conditions have voided the terms.
- Bankability starts with pricing degradation on day one. A storage asset that needs augmentation by Year 2 raises questions about reserves, cash-flow resilience, and lender confidence. Projects that model this upfront will close financing faster.
Model note: The financial model uses updated LFP cycle life (3,500 cycles, reflecting the 30°C central estimate) and system-level round-trip efficiency (85%), which produces a base-case fade of 3.54% – slightly higher than the 3.3% used in Part 1.
From Degradation to Dollars
Once usable energy begins to erode, a gap opens between what the battery was meant to deliver and what it can still deliver under real operating conditions. That gap can be closed through augmentation and higher support costs, or left open at the price of declining output, weaker reliability, or lost project value.
For a 10 MWh LFP system in Urban C&I Nigeria/Ghana, at a 15% real USD discount rate, the present value of total storage cost over 15 years is $4.57 million. The installed cost is $3.22 million. The difference: $1.35 million, or 42 percent of initial capex, is the Degradation Bill: the lifetime cost of keeping a degrading asset delivering what it was sized to deliver, under actual operating conditions.
That $4.57 million breaks into four components.
- Initial capex: $3.22 million, at $210 per gross kWh installed, after a 20% logistics uplift on a $175/kWh.
- PV augmentation capex: $0.60 million is the discounted cost of 9.87 MWh of replacement capacity added over 15 years.
- PV fixed O&M: $0.77 million, uplifted 20% for high-temperature field conditions.
- Warranty credit: $84,000 in Year 10, when the fleet’s state of health breaches the warranty floor of 70%, triggering a 75% remedy credit.
Most battery storage projects in African markets today are structured as a single capital event. The battery is purchased, installed, and treated as a depreciating asset on a fixed payback timeline. Augmentation budgets are absent. O&M contracts cover maintenance, not module replacement. Warranty language is read as a performance guarantee rather than a defensive legal instrument. That is the pricing error this model is designed to highlight.
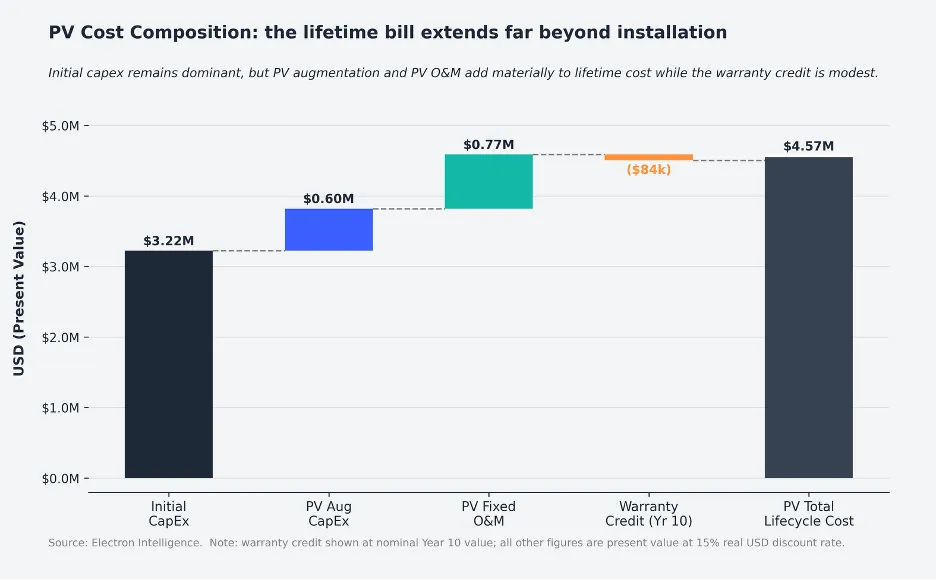
This chart breaks down the $4.57m total into its four components. Initial capex dominates at $3.22m, but the remaining $1.35m is what separates a project that modelled its economics correctly from one that did not. Augmentation ($0.60m) and O&M ($0.77m) are predictable costs of running a degrading asset in a high-cost field environment. The warranty credit ($84k) barely registers at this scale. Projects that treat warranty recovery as a meaningful offset are building on the wrong foundation.
The Two Paths: Augment, or Accept the Shortfall
The Cost of Doing Nothing
The easiest mistake in storage economics is to treat non-augmentation as the conservative option. It is not. Without capacity additions, a 10 MWh Lagos C&I system falls to 4.96 MWh usable by Year 15; half its original contracted output. The cumulative shortfall across the project life is 12,472 MWh of undelivered service. At a conservative $250 per MWh, the present value of that unmet commitment is $793,000. The project still pays. It just pays through underperformance rather than through augmentation.
That $793k does not appear as a line item in a developer’s project finance model. It appears as a conversation with an off-taker in Year 6 about why contracted capacity is not being met. It appears as a renegotiated PPA. It appears as a lender covenant breach when debt service coverage ratios depend on contracted revenue that the battery can no longer support.
The more important number is the timing. The shortfall does not begin in Year 10. It begins in Year 2, by a fraction of a MWh, and widens every year thereafter. A battery that requires augmentation by Year 2 is not malfunctioning. It is operating exactly as the physics predicts. The projects that do not account for this are not making a modelling error. They are making a pricing error. Every MWh the system can no longer deliver is value the project has to write off or pay to replace.
The Cost of Staying Whole
The augmentation path commits to maintaining the original service level every year. Every time usable output falls below the 10 MWh floor, fresh capacity is added. The system performs as contracted, but the cost of that performance does not stop at installation. It accumulates, year by year, in replacement modules.
Over 15 years, the model builds a cumulative augmentation spend of $1.61 million in nominal terms, discounted to $0.60 million at 15%. Augmentation spend is front-loaded in proportional terms because early degradation is fastest: Years 2–6 each require $120–$132k in augmentation capex. By Year 15, the annual spend has declined to $104k as replacement costs fall at 5% per year; a conservative assumption relative to the 45% single-year drop BNEF recorded for stationary storage pack prices in 2025. Add PV fixed O&M of $0.77 million, net of the $84k Year 10 warranty credit, and the total present value cost of keeping the system whole is $4.57 million.
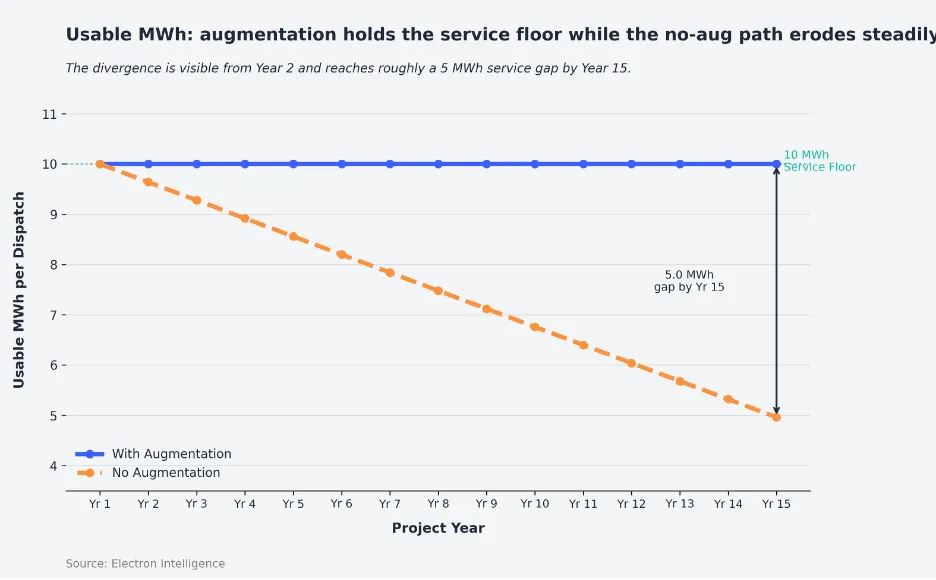
The augmented line holds flat at 10 MWh throughout the project life. The no-augmentation line declines to 4.96 MWh by Year 15, half the original commitment. This is not a worst-case scenario; it is the base case for a project that commits to a service level without a maintenance budget. By Year 8, the un-augmented system delivers less than 70% of contracted output. For any project structured around a guaranteed energy supply, that is a contract breach, not a performance footnote.
The Crossover: Three Levers That Move the Decision
Whether augmentation is the economically dominant choice depends on three inputs that do more work in this model than anything else.
Fade rate is the master variable. At 3.54% per year, augmentation begins in Year 2 and runs every year for 15 years. Cut the fade to 2% through active thermal management or a lighter cycling regime, and the first shortfall year moves to Year 4. The augmentation burden drops. For developers who can influence operating conditions, such as shading, forced-air cooling, and conservative dispatch strategy, fade rate is the single biggest dial they can turn.
Shortfall value determines the financial logic of the no-augmentation path. At $250/MWh, the accumulated shortfall costs $793k in PV terms. At $500/MWh, appropriate for a critical-load hospital backup in an off-grid context, that number doubles, and the augmentation path dominates from Year 3 onwards. The right number is not a modelling assumption; it is a contract question that should be answered before financial close.
Logistics uplift is the most geography-specific input. The 20% uplift applied to the Lagos/Accra context reflects Nigeria’s import cost structure: duties, levies, VAT, port handling, and inland freight. That 20% assumes favourable tariff classification (HS 85 power sector machinery) and is at the low end of the observed range; practitioner experience suggests all-in costs frequently reach 25–30%. A South Africa or Morocco deployment, with established supply chains and 5% logistics friction, reduces initial installed capex by over $200,000 on a 10 MWh system: enough to change the project’s return profile.
Not every African BESS cycles hard in practice. Some systems are oversized relative to their actual dispatch. Gentler cycling flattens the cost curve and delays augmentation. But it does not remove the underlying choice. Cycling intensity changes the timing of the crossover; it does not eliminate it.
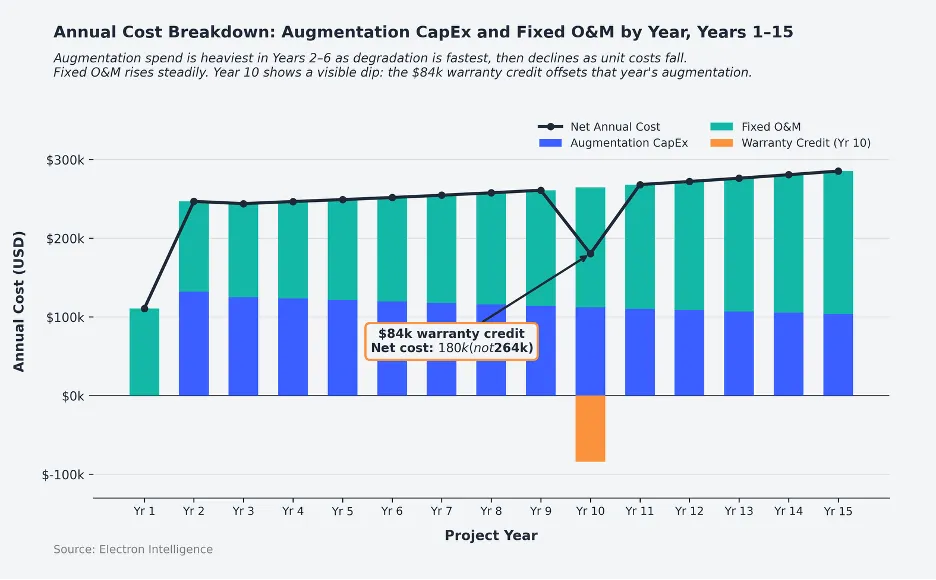
This chart confirms the core point: battery storage in hot, import-dependent markets is not a one-time capital event. It is a continuous cash obligation. Augmentation capex peaks in Years 2–6 ($120–$132k per year), then declines as replacement costs fall. The Year 10 warranty credit ($84k) reduces that year’s net cost from $264k to $180k, but it fires once. Projects that do not budget for this annual spend are not being conservative. They are leaving the cost off the page.
Warranty Limits and the Bankability Question
Warranty support matters, but it does not close the problem automatically. The World Bank estimates annual BESS warranty cost at around 0.8% of equipment cost starting in Year 3, and augmentation cost at around 2.5% of equipment cost, and notes both figures can be higher in developing-country projects due to remote access constraints, limited monitoring, and weaker local service capacity. In other words, even the mechanisms designed to protect battery performance are themselves part of the lifetime cost structure.
The model credits $84k in Year 10 at 75% remedy coverage. In practice, warranty recovery in high-temperature deployments depends on whether operating conditions have been maintained within the thermal and cycling limits that preserve warranty validity. Many have not. The $84k is a ceiling estimate, not a contractual guarantee.
That is the point at which degradation becomes a financing issue. A storage asset that requires meaningful intervention by Year 2 or Year 3 is no longer only an operations problem. It raises questions about reserve sufficiency, cash-flow resilience, warranty enforceability, and whether the project can still deliver what it promised lenders.
That does not make every such project unbankable. It means the financing narrows unless the degradation path is priced from the start. The structural instrument that closes the gap is a Major Maintenance Reserve Account: a ringfenced fund that sweeps 2–3% of initial capex per year to pre-fund augmentation. It is the standard mechanism in mature power project finance. It is absent from almost every battery storage deal currently being structured in African markets.
BNEF’s 2025 price data offers one reason for optimism: stationary storage pack prices fell 45% in a single year to $70/kWh, making replacement costs lower than they were when most current projects were underwritten. The economics of augmentation are improving. The structures to capture that improvement have not yet caught up.
The Bottom Line
Every battery storage project in a hot, import-dependent market carries two cost envelopes: the installation price, and the price of keeping the system credible over its life. For a 10 MWh LFP system in Lagos or Accra, the second envelope is $1.35 million, 42% of the initial spend, and it begins accumulating in Year 2.
The projects being financed across African markets today are mostly priced on installation cost. That is not irrational. It is incomplete. Once degradation is expressed in dollars rather than state-of-health curves, the question changes. It is no longer only about which battery to buy. It is how the project intends to absorb, manage, and finance the cost of keeping that battery deliverable.
The battery that delivers on its promise over 15 years is the one whose full cost was modelled before the contract was signed.