A Landed Cost Breakdown of Solar in South Africa and Kenya, and What Sets Them Apart
South Africa and Kenya have taken markedly different approaches to importing solar equipment. While South Africa applies import duties and VAT, Kenya exempts solar modules from both but imposes other import levies and faces higher freight costs. This analysis compares the landed cost of importing identical solar modules and inverters into both markets using standardized equipment and procurement assumptions to isolate the effect of each country's import regime on the cost of bringing solar equipment into the market.
Executive Summary
Recoverable VAT reduces the difference in landed costs between South Africa and Kenya to less than 2%. Excluding South Africa's recoverable import VAT lowers its effective landed cost to $0.161/W, leaving it marginally below Kenya's $0.164/W.
Freight costs and non-refundable import charges account for most of the remaining difference in landed costs. South Africa's 10% module import duty is largely offset by Kenya's higher freight costs and import levies, leaving the two markets with broadly similar effective landed costs.
Future changes to South Africa's import duty could have a significant effect on the cost comparison. Increasing the module duty would raise South Africa's landed cost, while changes to Kenya's current tax exemptions would have a comparatively smaller effect
The cost of importing solar equipment differs before recoverable taxes are taken into account
Importing identical solar equipment costs more in South Africa than in Kenya. Based on a standardized 20 MW utility-scale solar project, modules and inverters land at $0.185/W in South Africa compared with $0.163/W in Kenya; a difference of $0.021/W, or about 13%. Because both projects use the same modules and inverters sourced from the same manufacturer at the same factory price, the difference reflects only the cost of importing the equipment rather than the equipment itself.
The additional cost arises from the different import regimes applied in each market. In South Africa, import duty and VAT account for a significant share of the amount paid when equipment enters the country. Kenya exempts imported solar modules from duty and VAT but incurs higher freight costs, together with non-refundable import levies and other import-related charges. These different cost structures produce the gap in landed cost at import despite identical equipment prices.
Although South Africa appears more expensive at import, not every charge paid at the border remains part of the project's long-term equipment cost. Distinguishing between temporary and permanent import costs changes how the two markets should be compared and is central to understanding the difference between import costs at the border and the cost ultimately borne by a project.
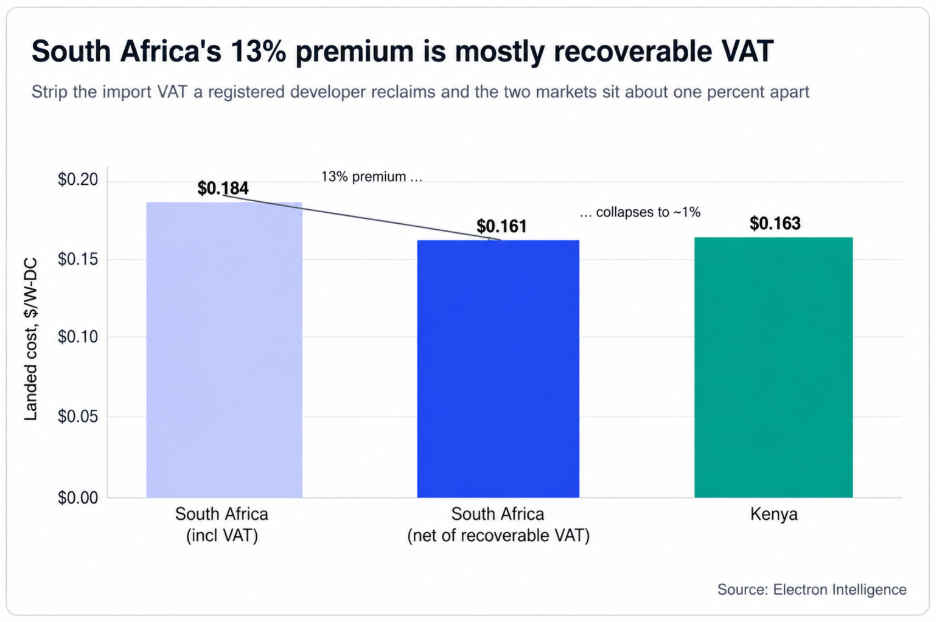
Figure 1. South Africa appears more expensive at import, but most of the difference reflects recoverable VAT rather than permanent project costs.
Recoverable VAT changes the effective cost of importing solar equipment
South Africa's higher import cost is largely explained by its 15% import VAT. Although the tax increases the amount paid when equipment enters the country, it does not necessarily become a permanent cost of the project.
For VAT-registered developers, import VAT is recoverable through South Africa's VAT system when imported goods are used to make taxable supplies. As a result, import VAT affects the timing of cash flows rather than the permanent cost of importing solar equipment.
This distinction changes the comparison between South Africa and Kenya. Including import VAT, solar equipment lands at $0.185/W in South Africa compared with $0.163/W in Kenya. Excluding the recoverable VAT reduces South Africa's effective landed cost to $0.161/W, leaving it marginally below Kenya's $0.163/W.
Freight costs and import charges account for the remaining cost difference
Once South Africa's recoverable VAT is excluded, the difference in effective landed costs is explained by the remaining import cost components. These include freight, customs duties, import levies, and other non-recoverable charges that form part of the final cost of bringing equipment into each market.
The composition of these costs differs between the two markets. South Africa applies a 10% import duty on solar modules, making customs duty the largest non-recoverable import charge. Kenya, by contrast, exempts modules from import duty but incurs higher freight costs on the Mombasa shipping route and applies non-refundable import levies, including the Import Declaration Fee and the Railway Development Levy. Although the cost components differ, they result in similar effective landed costs.
Kenya's higher freight costs and non-refundable import charges largely offset South Africa's 10% module import duty. Although the composition of import costs differs between the two markets, neither retains a meaningful equipment-cost advantage under the assumptions used in this analysis.
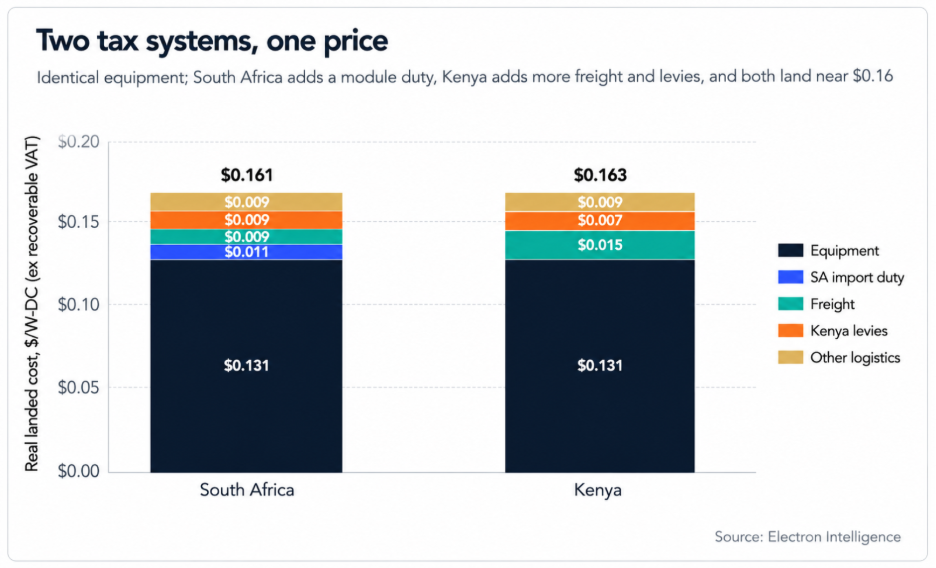
Figure 2. South Africa adds a module duty, Kenya adds freight and levies, and both land near $0.16/watt.
Future policy and freight changes could reshape the cost advantage
The comparison presented in this analysis reflects current import policies, freight rates, and equipment prices. Changes to any of these inputs would alter the effective landed cost of solar equipment, although not all variables have the same influence on the final outcome.
Among the policy variables, South Africa's import duty has the greatest effect on the comparison. The current analysis assumes a 10% duty on imported solar modules. Increasing the duty to 20% would raise South Africa's effective landed cost from $0.161/W to approximately $0.172/W, exceeding Kenya's $0.163/W under the same assumptions. This demonstrates how changes in import duty could alter the relative cost position of the two markets.
Freight costs represent the second major source of uncertainty. Shipping costs are influenced by global logistics conditions and can change independently of equipment prices or import policy. Because Kenya's landed cost includes higher freight costs than South Africa's under the assumptions used in this analysis, changes in freight rates could either narrow or widen the difference in effective landed costs.
Taken together, these scenarios suggest that South Africa's module import duty and freight costs remain the two variables most likely to alter the relative cost position of the two markets. Under current policies, changes to Kenya's tax treatment are less likely to materially affect the comparison.
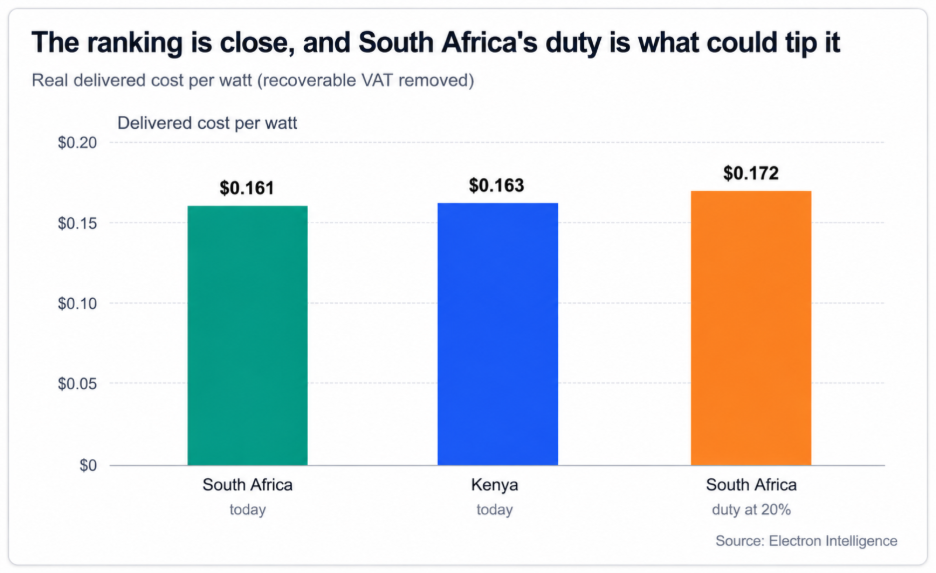
Figure 3: South Africa at $0.161 sits just below Kenya at $0.163 today, but a rise in South Africa's duty to 20% would take it to $0.172, above Kenya.
Bottom Line
The comparison demonstrates the importance of separating recoverable taxes from permanent import costs when assessing landed cost. Although South Africa appears more expensive at import, most of the difference reflects recoverable VAT rather than a lasting difference in project equipment costs. After adjusting for recoverable VAT, the two markets converge to broadly similar effective landed costs.