Tracked $13.84 billion of disclosed investment activity across 306 deals in 43 African countries in 2025.
Africa's energy transition produced no shortage of announcements in 2025. This report separates the capital that was actually committed from the capacity that actually came online, and reads the year the way the institutions financing it do: deal by deal, and risk by risk. We tracked $13.84 billion across 306 deals in 43 countries, against 74,461 MW of announced projects, of which 14,589 MW reached operation.
Capital followed bankability, not headline size
The deals that closed shared a profile: a creditworthy offtaker, risk allocated to the parties able to carry it, and a clear path from signing to operation. Large pipelines without those features mostly stalled. Much of the year's volume ran through repeatable platform and program structures, which let investors back a manager or a portfolio instead of underwriting each project from scratch.
The transition is still, overwhelmingly, a power and grids story
Clean Electrons, meaning generation, grids and the businesses that connect them, took $13.61 billion, or 98.3 percent of the total. Generation drew $8.15 billion, the platforms that make it investable $2.41 billion, and grids and networks $1.56 billion, landing where weak infrastructure was capping new supply. Clean cooking, clean molecules and transport raised under $230 million between them.
Debt and development finance carried the year
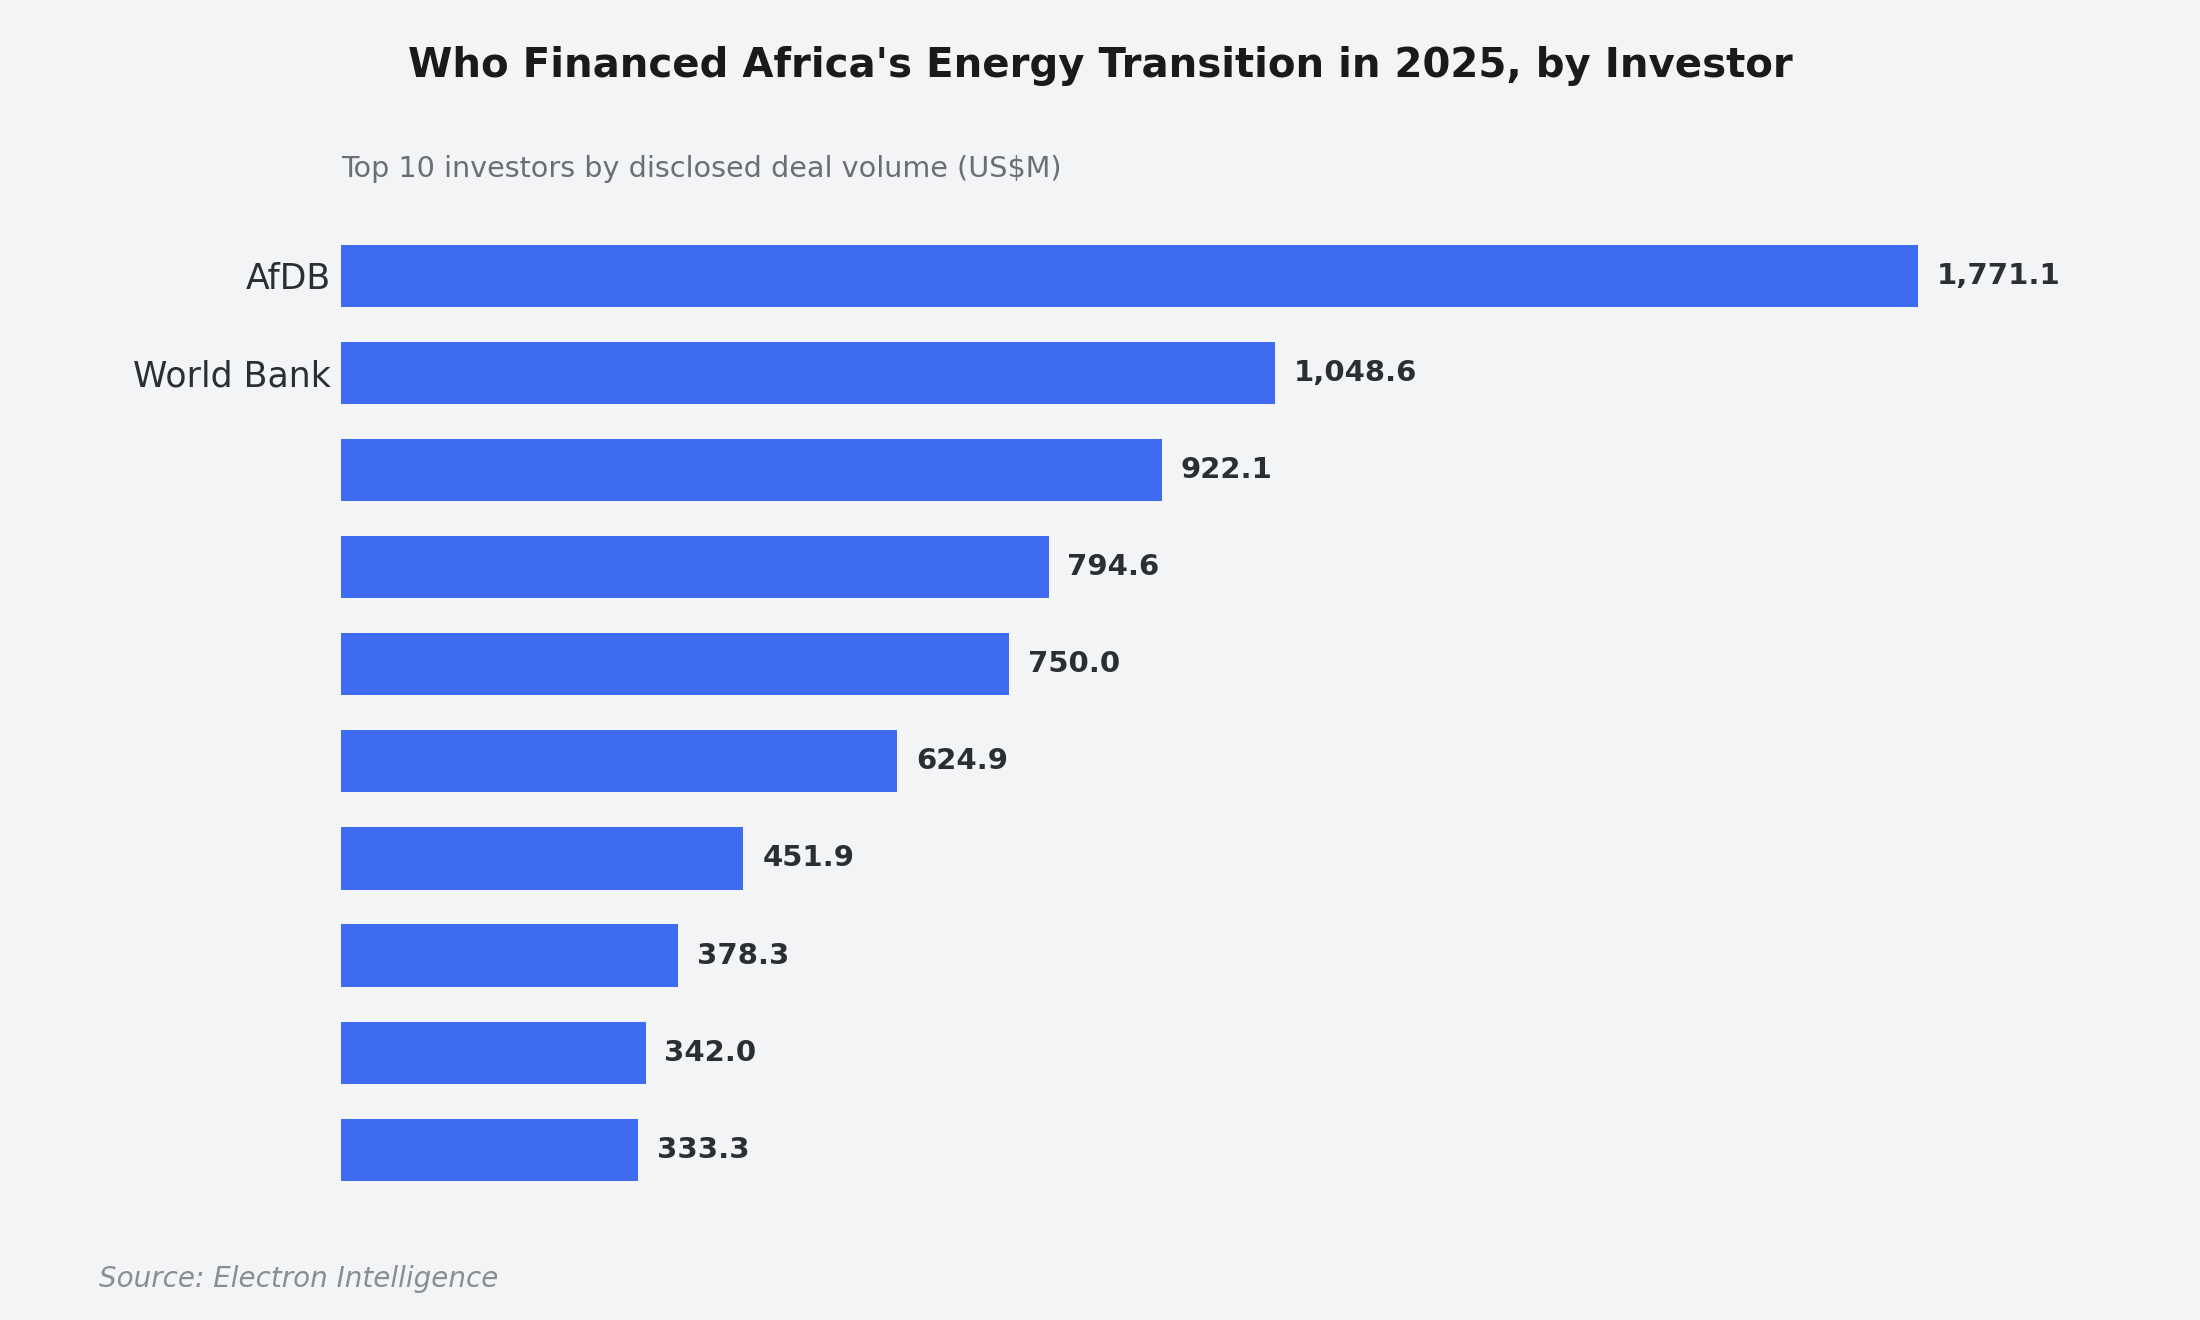
Debt supplied $9.06 billion against $2.49 billion of equity, with grants, guarantees and blended finance covering the ground commercial terms could not reach. Development finance institutions, led by the African Development Bank at $1.77 billion, anchored a third of the market; private capital supplied the rest. A further $1.4 billion changed hands through fifteen acquisitions, as buyers consolidated around assets that already work.
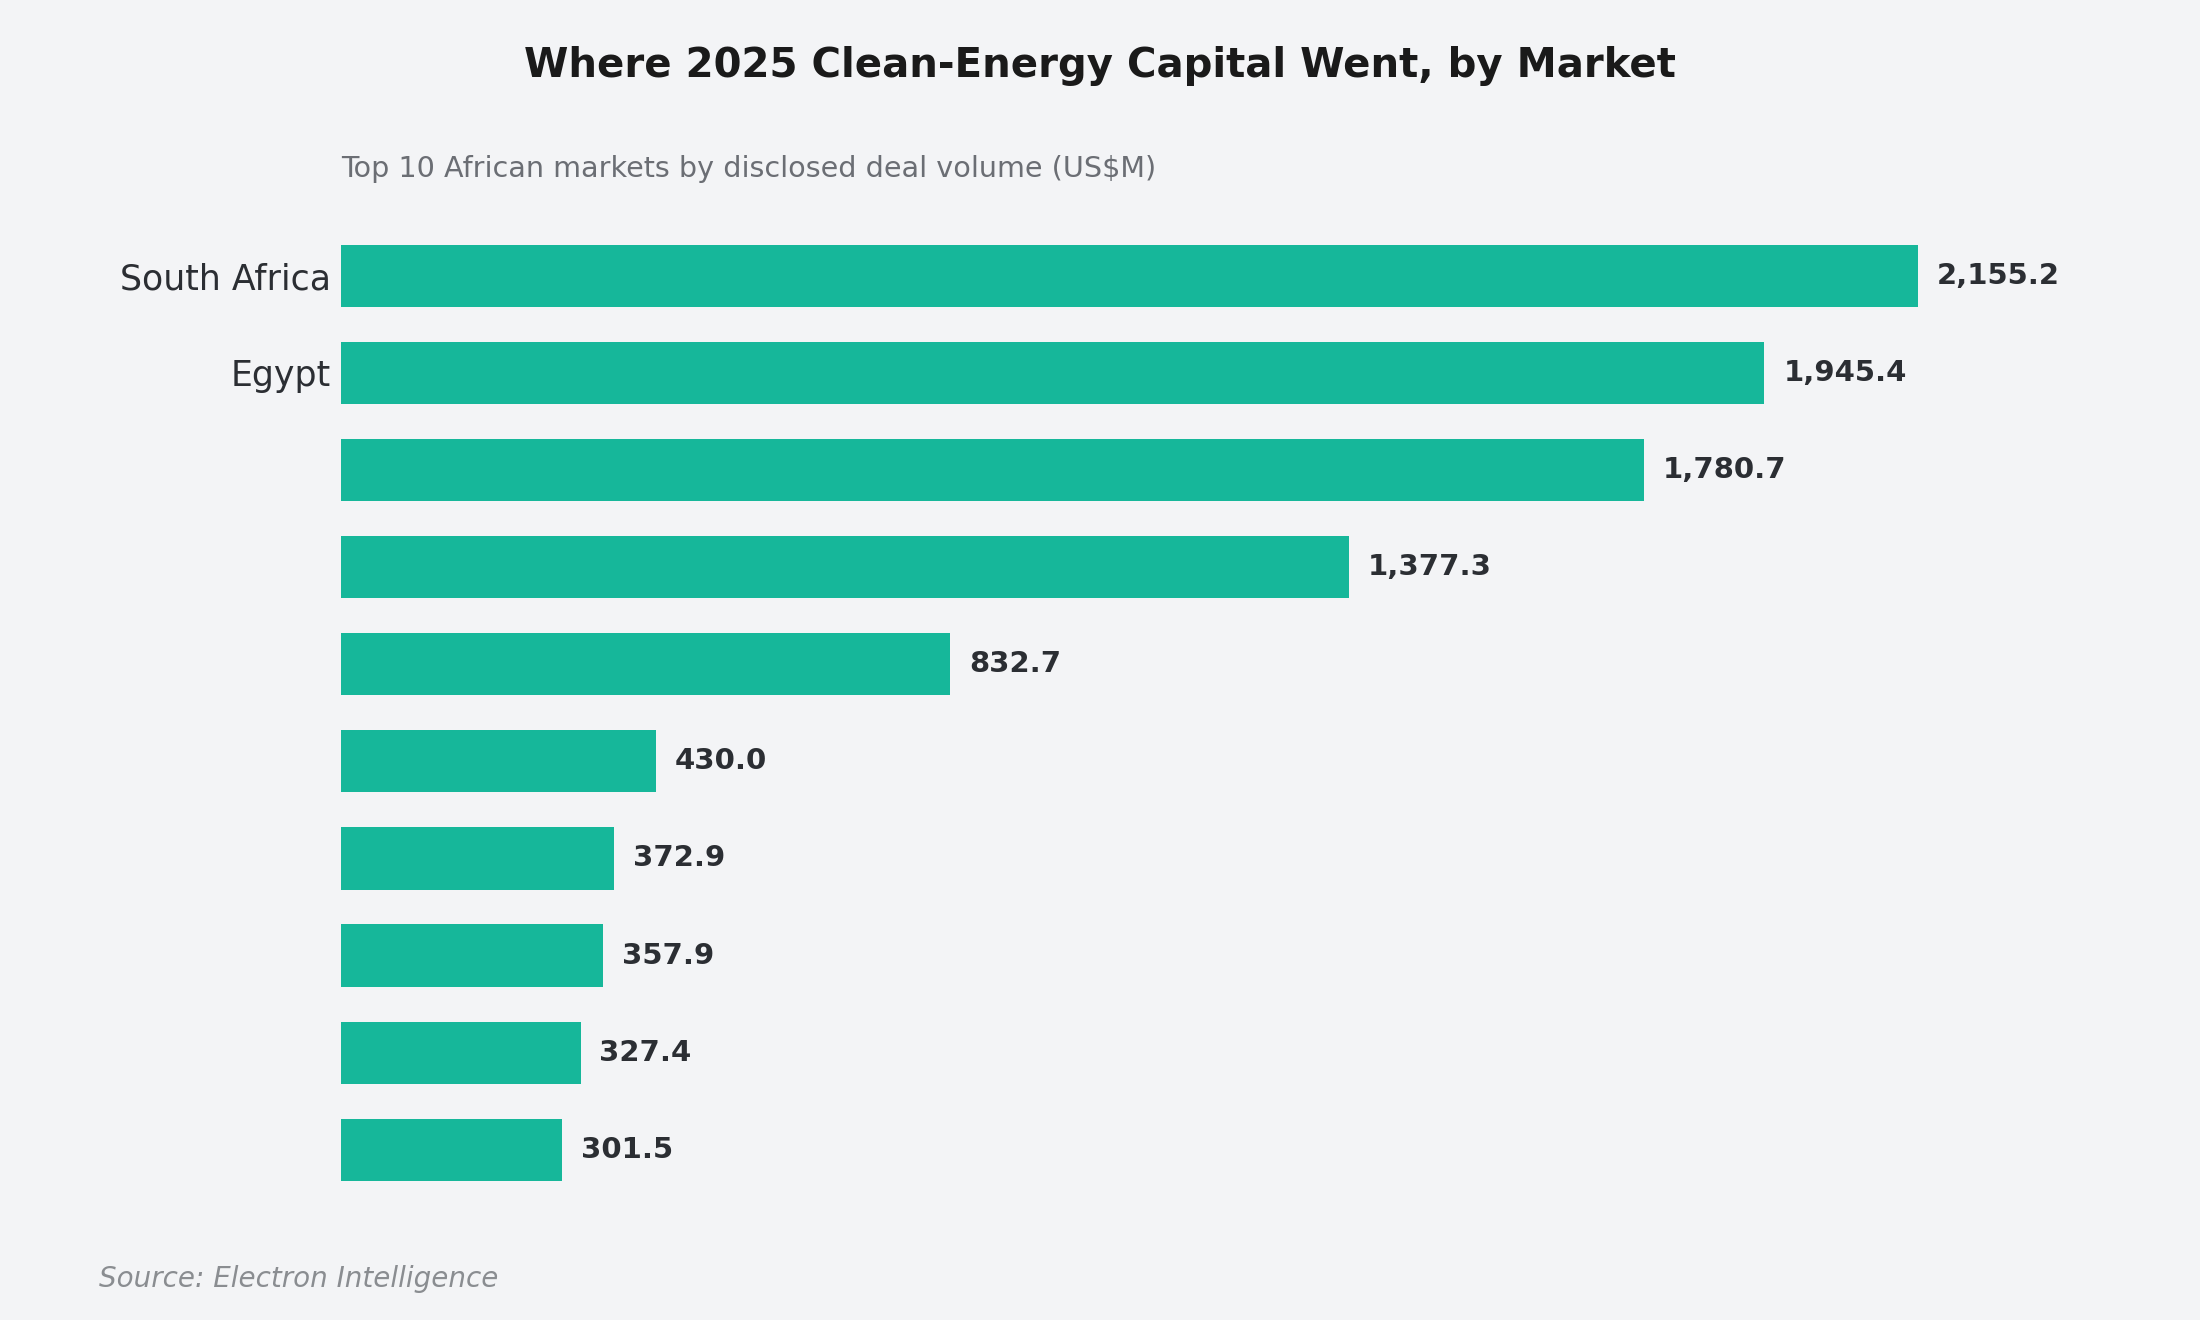
The money concentrated in a few markets.
Ten countries absorbed $9.88 billion, close to three-quarters of the total, led by South Africa, Egypt, Nigeria, and Morocco. West and North Africa set the regional pace, while Southern Africa's volume came through the widest range of deal structures.
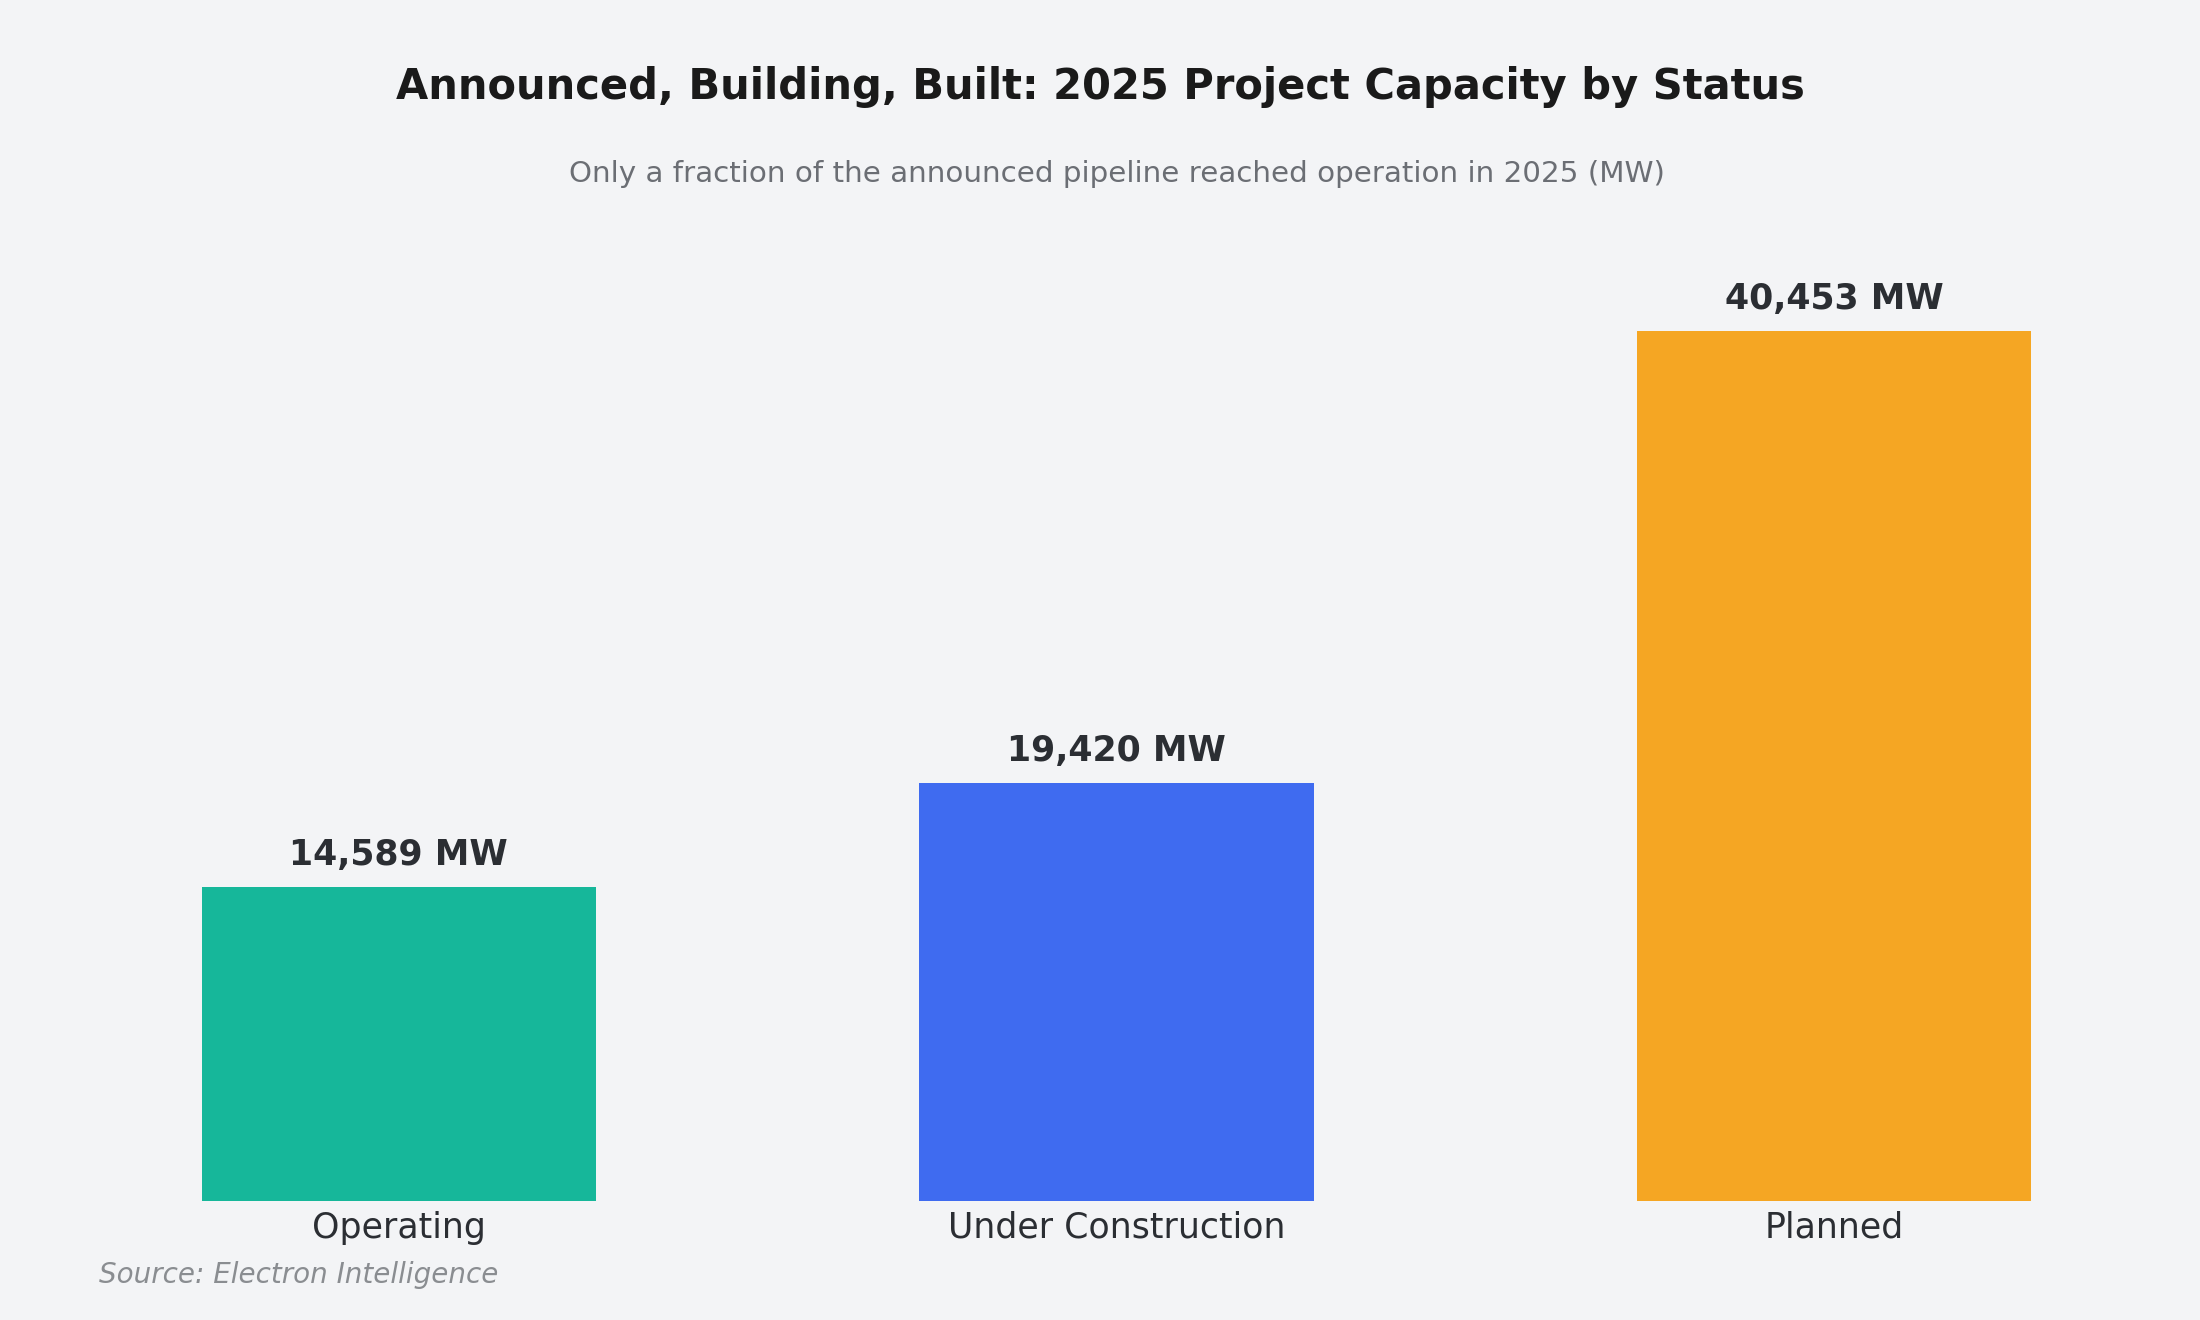
Announcements ran well ahead of delivery
Against 74,461 MW announced across 47 markets, only 14,589 MW reached operation. A few outsized projects inflate the headline. The rest comes down to the gates that decide whether a megawatt gets built: interconnection, a bankable offtake agreement, land and permits, and the foreign-exchange and import arrangements that determine whether equipment ever arrives.
Conversion is the number to watch in 2026
Generation still dominates the pipeline, but the capacity genuinely advancing sits in integrated projects, where we track 7.7 GW and developers already hold 4.5 GW under construction. The market is funding capacity first and the infrastructure to support it second. This report exists to help the institutions financing that build-out compare deals on a common basis, see where risk was priced and absorbed, and judge how much of the pipeline will clear.
Read the full report with Enterprise access
You’ve read the executive summary. The complete analysis, every chart and table, and the source data workbook are included with our paid Enterprise access.