Import duty and value-added tax across 15 markets, 80 commodities, and twelve years of tariff data.
A market-by-market reading of what it actually costs to import clean-energy equipment into Africa. Africa's Import Tariffs and the Energy Transition measures import duty and VAT across fifteen markets, eighty commodity lines and twelve years of data, and turns 16,306 customs observations into a single, comparable view of border cost. For developers, financiers, and traders, it answers the most important question: how much of a project's budget disappears at the port, and how that figure changes from one country, commodity, and trade route to the next.
For anyone costing a clean-energy project in Africa, the border is one of the largest and least predictable line items, and it changes with every country, commodity and trade route. This report measures it directly, reading import duty and value-added tax across fifteen markets, eighty commodity lines and twelve years of data from 16,306 customs observations.
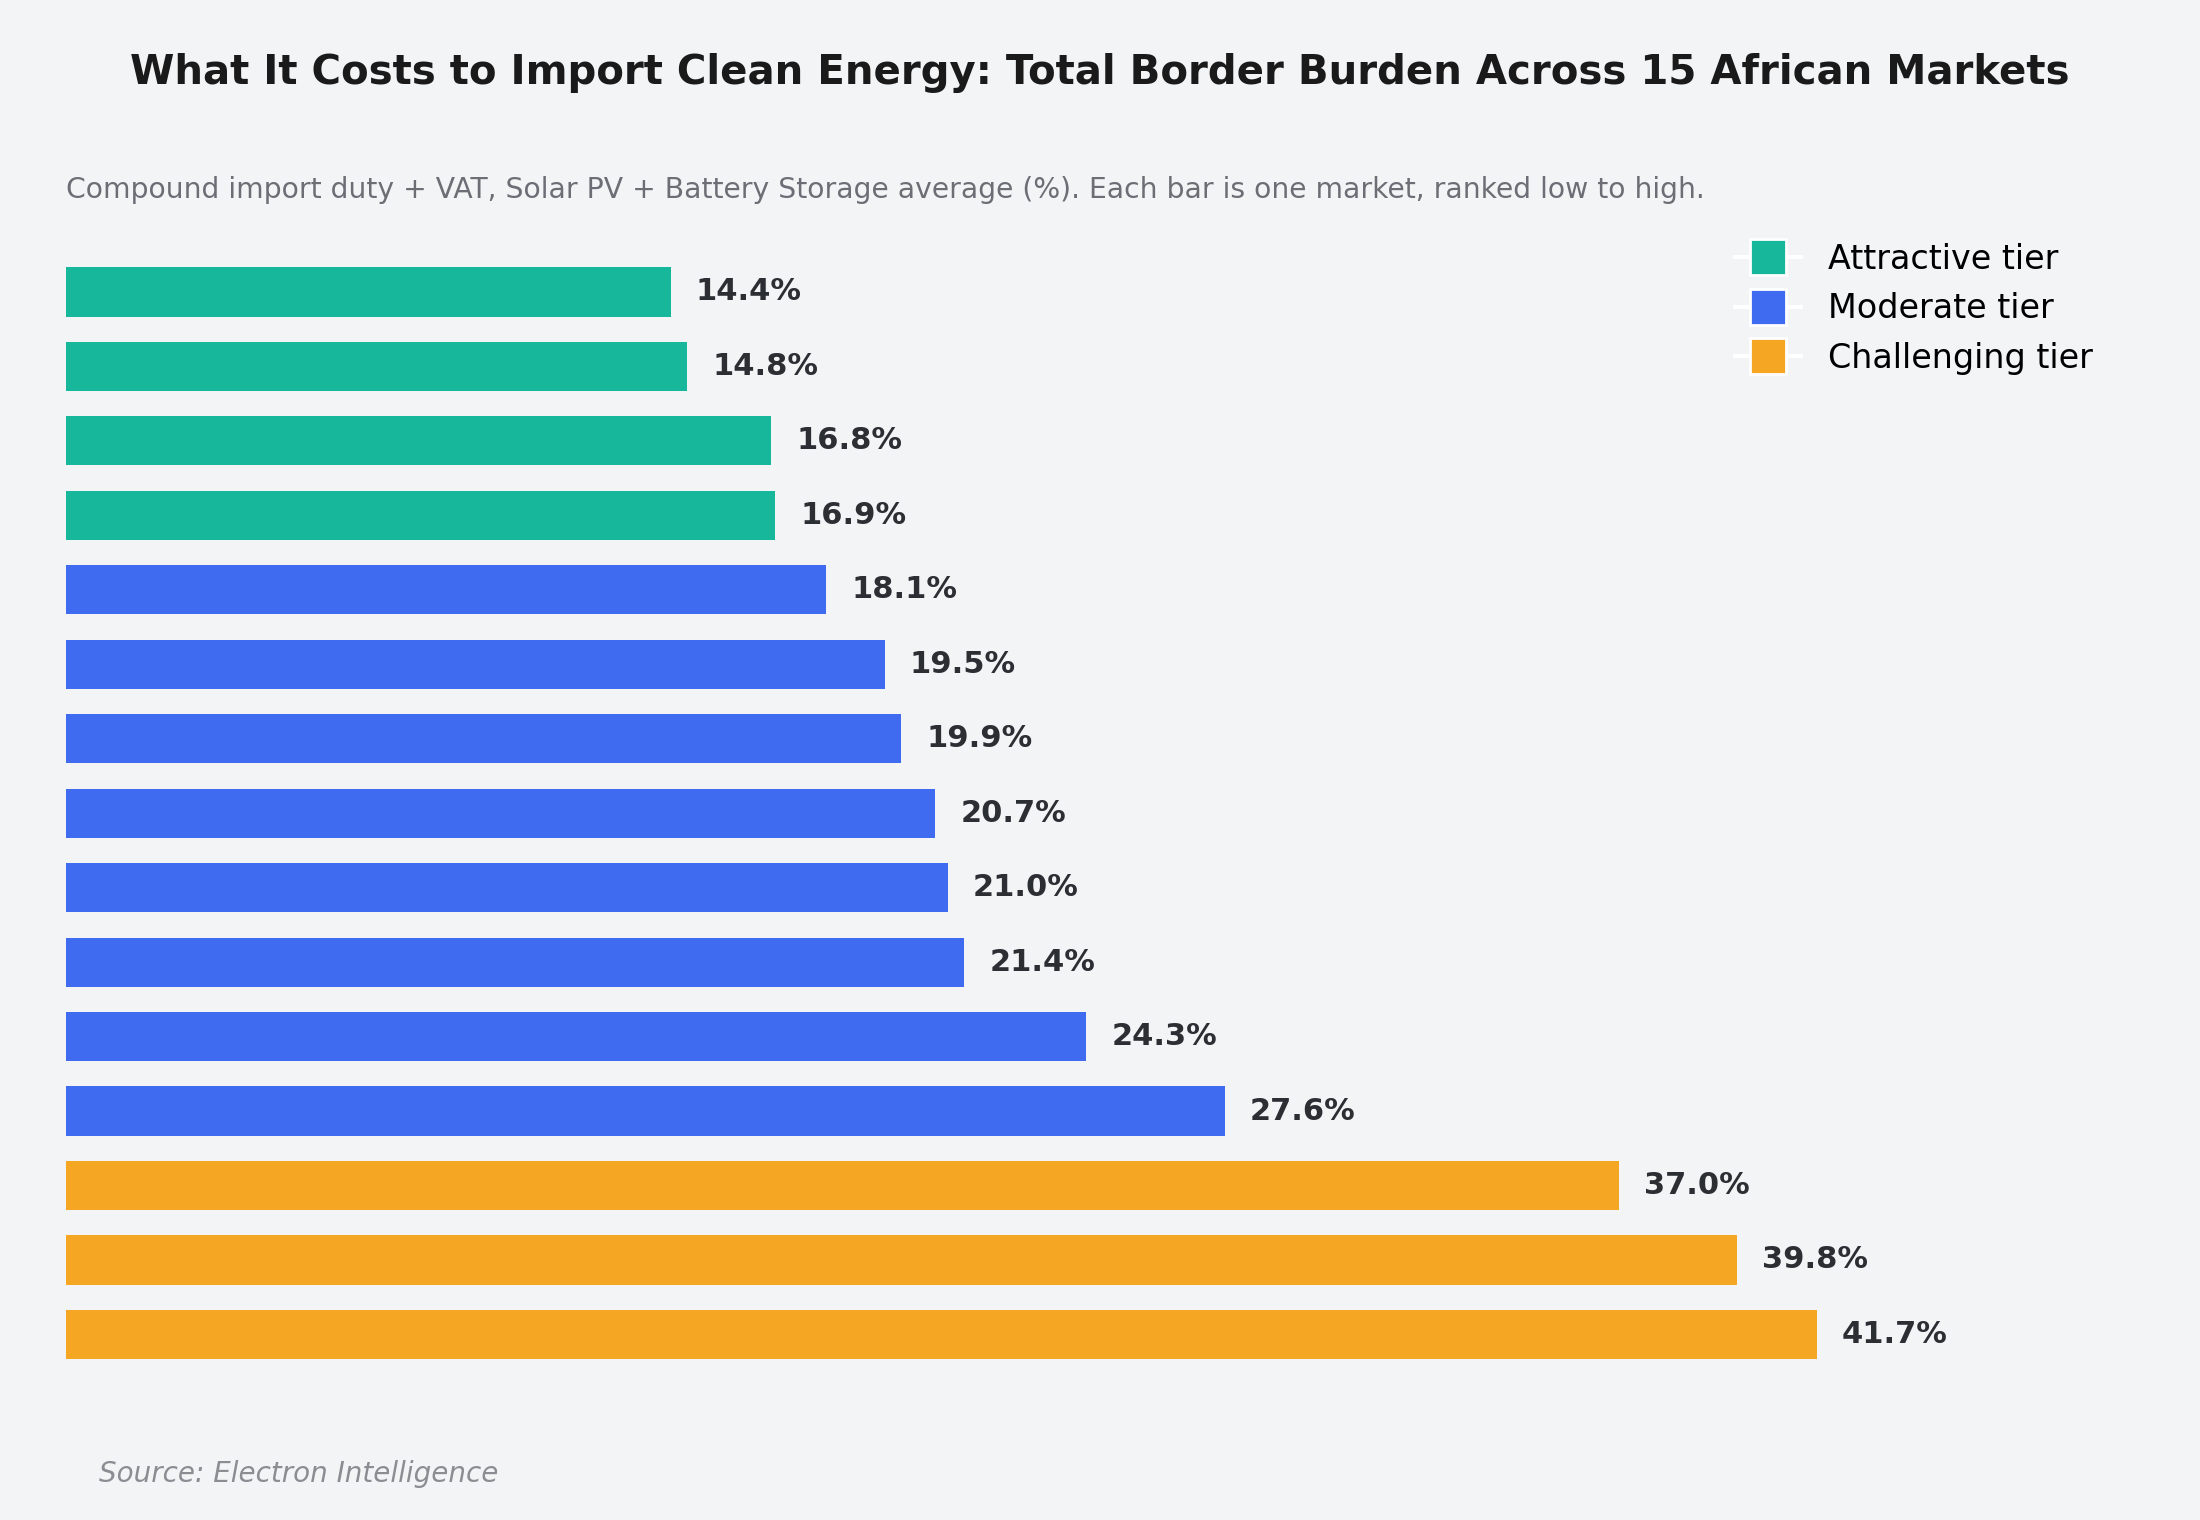
Africa is not one import market; it is at least three
The same solar-plus-storage shipment clears Nigeria at a 14.4 percent compound border burden and Tunisia at 41.7 percent, a 27-point swing on identical equipment. An accessible tier sits below 17 percent, led by Nigeria, Zambia, Kenya and Senegal. A broad middle band runs from 17 to 28 percent. A North African cluster of Morocco, Algeria and Tunisia carries burdens of 37 to 42 percent, which VAT rates near 20 percent push higher still. Any strategy that treats the continent as one market will misprice most of it.
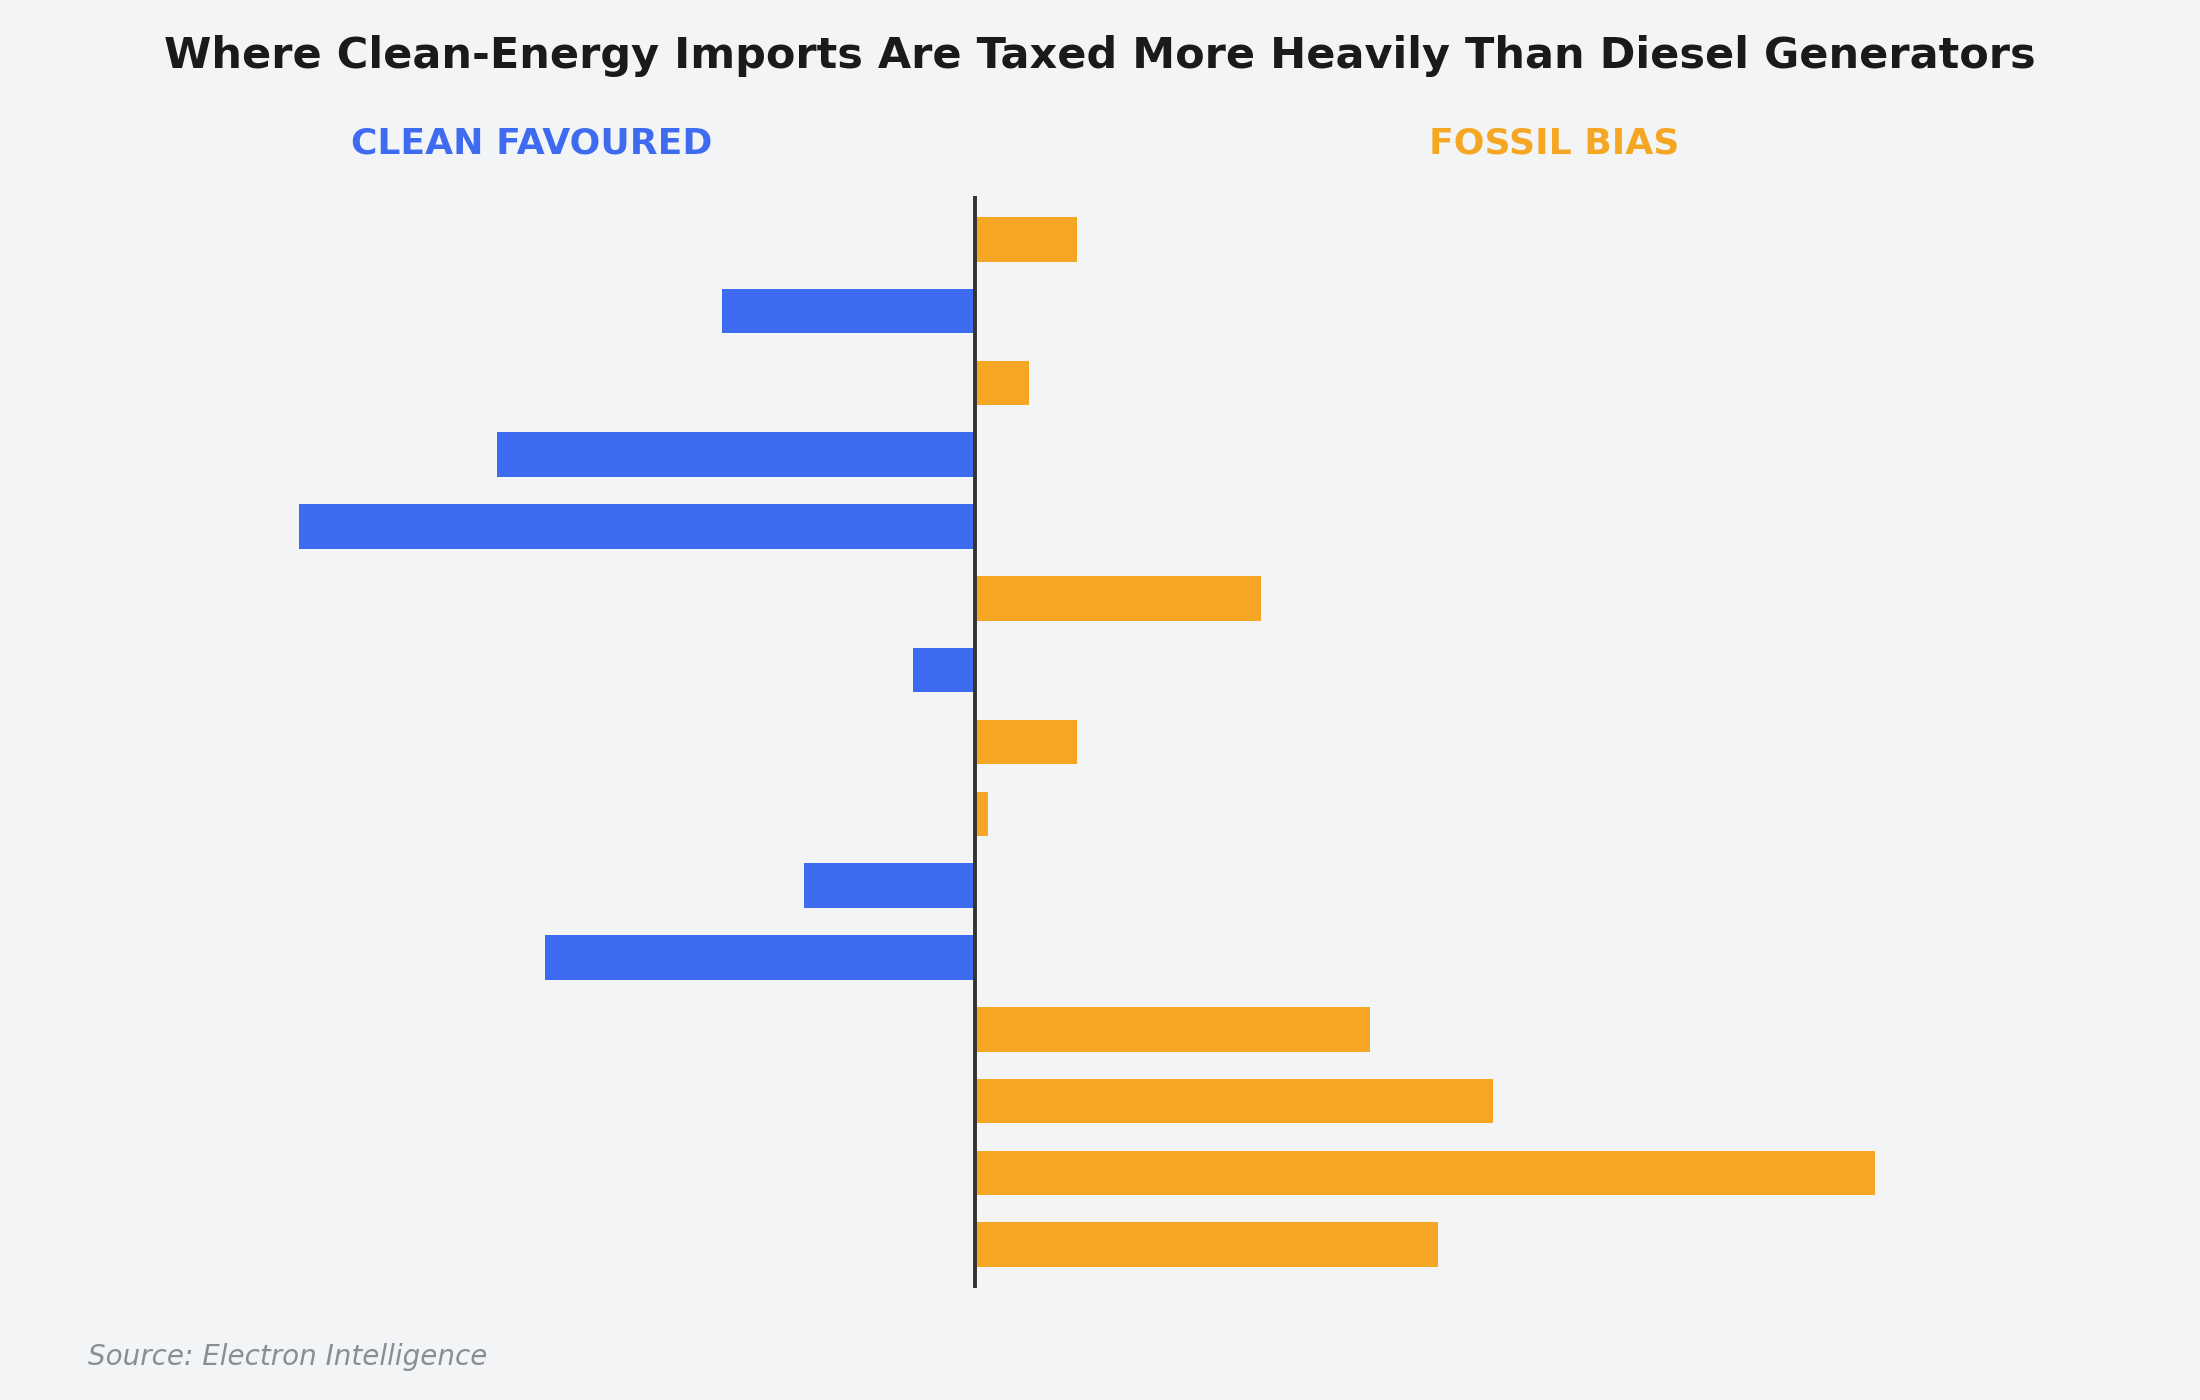
In most markets, the tariff code still favours diesel over clean energy
In nine of the fifteen markets, importing a diesel generator costs less at the border than importing the solar panels and batteries meant to displace it. Only Botswana, South Africa, Senegal, Zambia and Benin tax clean imports more lightly than diesel. The bias is structural: regulators wrote most of these schedules before the energy transition became a priority, and the old logic still sits in the rates.
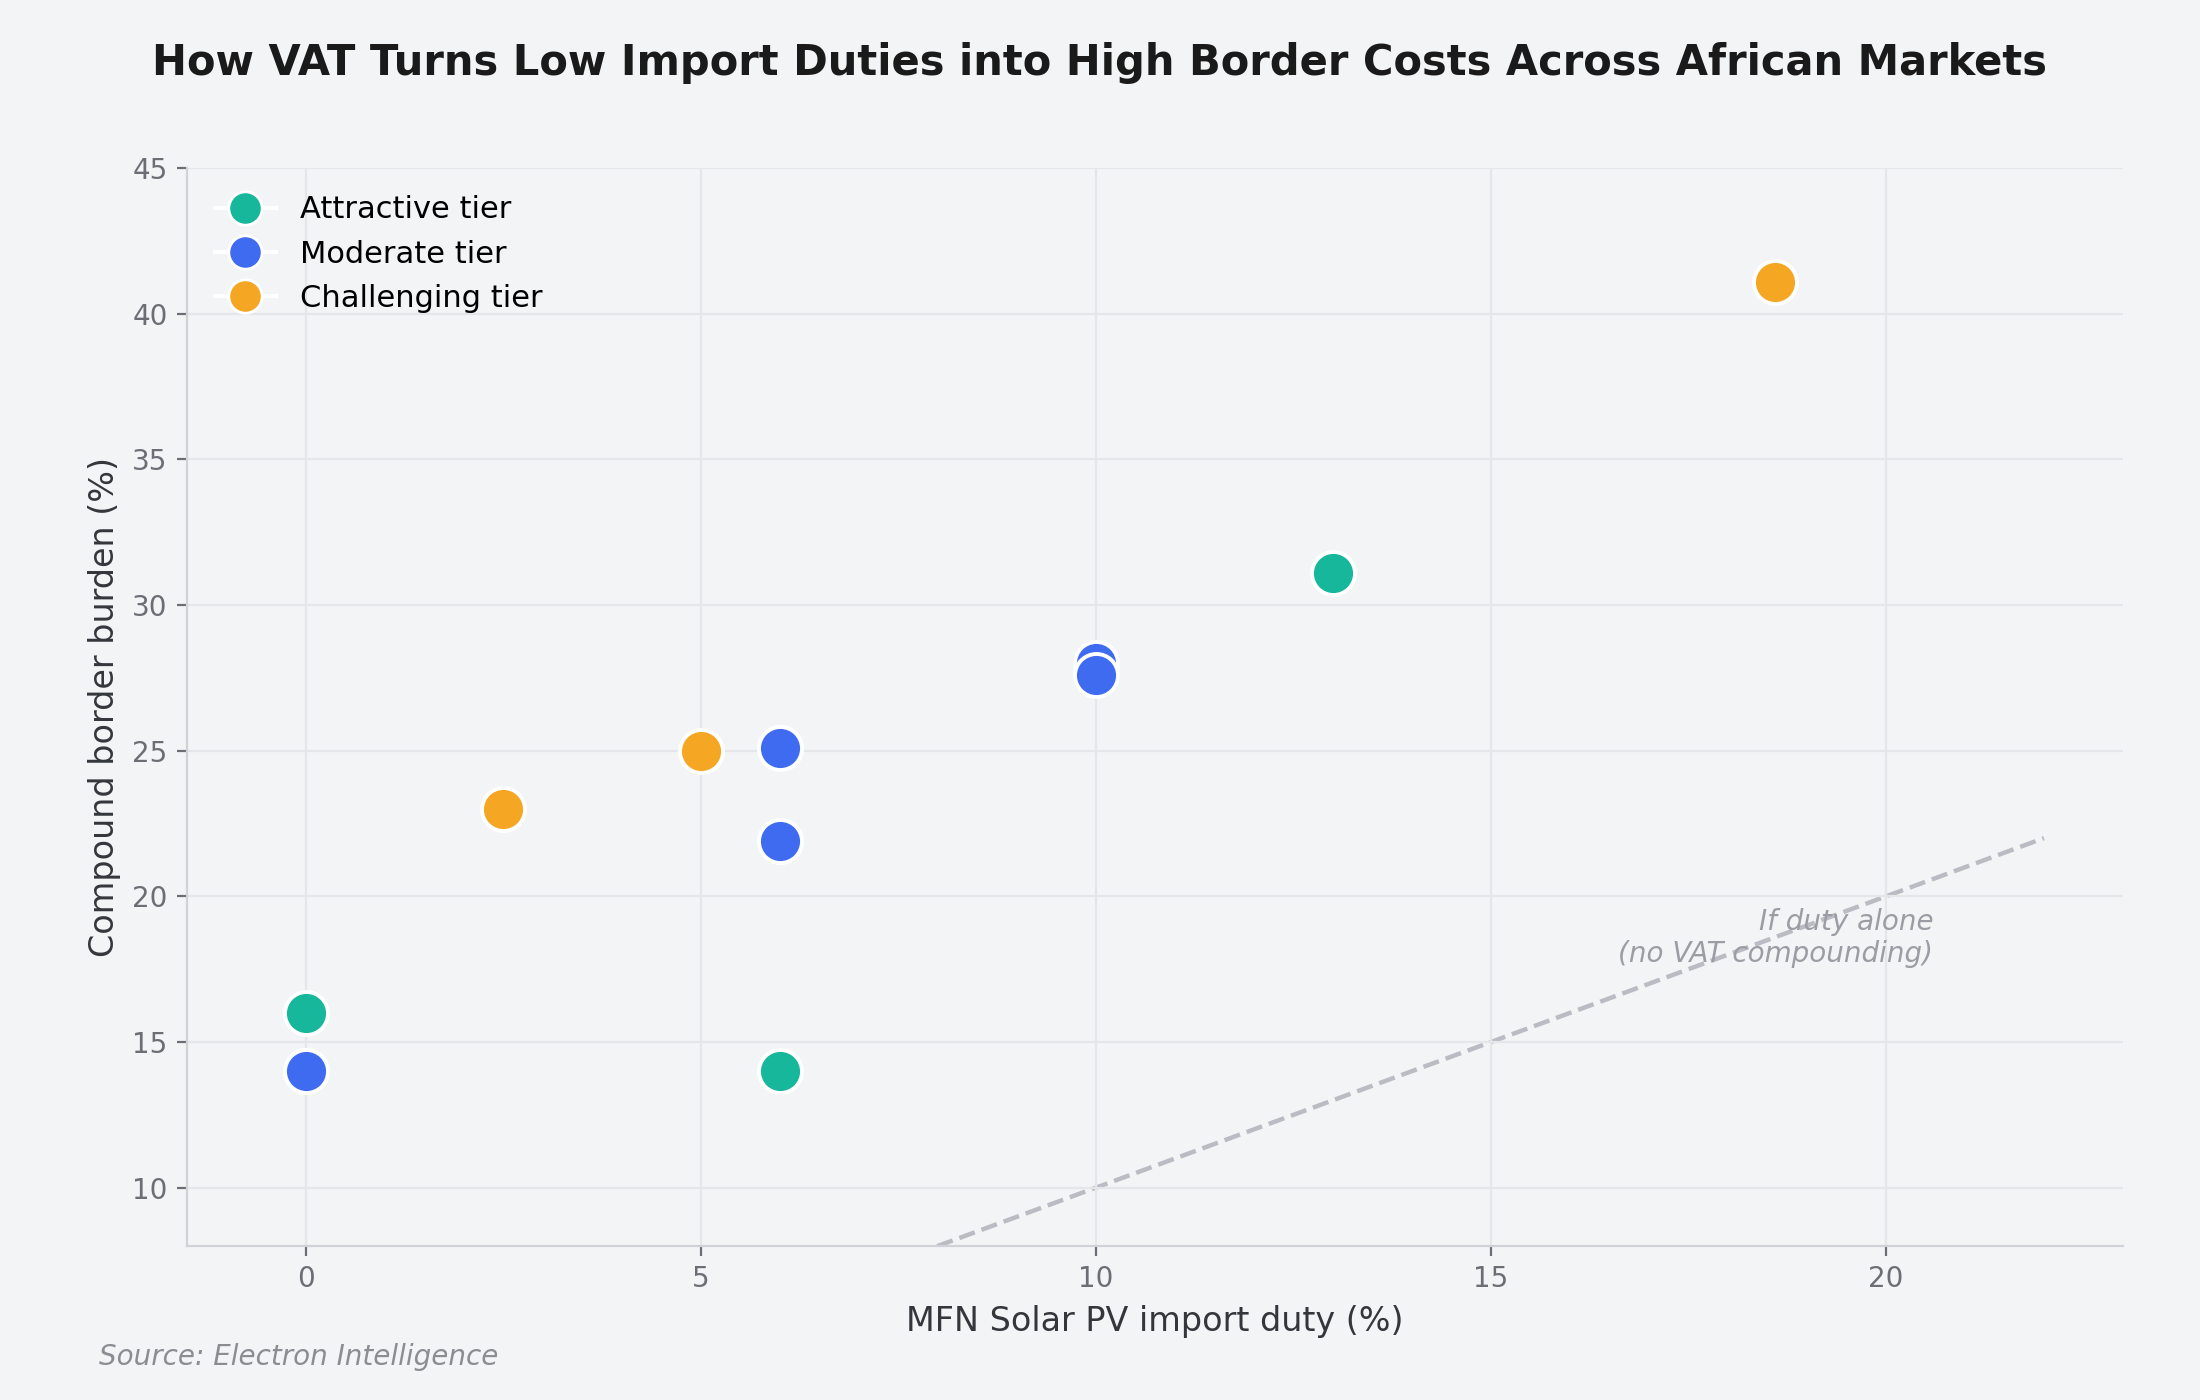
VAT, not the headline duty, is where the cost hides
Egypt charges no duty on solar PV, yet the border burden still reaches 14 percent on VAT alone. Above a 16 percent VAT rate, every point of duty adds more than a point to landed cost, which is why high-VAT markets punish equipment imports even where nominal duties look moderate. Reading the duty rate alone understates the real cost in every market.
Policy is moving, and rarely toward liberalisation
The 2023 ECOWAS Common External Tariff reset five West African markets to a 6 percent solar baseline, a bloc-level change no single government can appeal. South Africa reversed a seven-year zero-rate to 10 percent in 2024. Tunisia has climbed across the decade, while Egypt held zero and Morocco held 2.5 percent. Beneath the finished-goods rate, eleven of the fifteen markets tax raw materials more heavily than finished panels, quietly penalising the local assembly they hope to attract.
The cheapest savings sit unused
Preferential trade-zone access only matters where it opens a real gap against the standard rate. Zambia and South Africa each offer about 10 points of duty relief through COMESA, SADC or EFTA, and the five ECOWAS markets now carry a genuine 6-point intra-bloc advantage. The saving needs only a qualifying certificate of origin at clearance, with no change of equipment or supplier, yet most importers still ship at the standard rate.
For capital, the border is a line item most models understate
Duty and VAT are real, modellable costs, and the flat customs allowance common in development-finance models understates them by a factor of three to five in the most demanding markets. The statutory burden is the right comparator and the minimum defensible line item, preferential routing is cost saved for the price of paperwork, and a duty-trajectory scenario belongs in the base case for the middle and restrictive tiers. This report exists to give the institutions financing African power a single, comparable view of what crossing the border actually costs.
Read the full report with Enterprise access
You’ve read the executive summary. The complete analysis, every chart and table, and the source data workbook are included with our paid Enterprise access.