EI Research Brief
In this issue: Our maiden financial benchmark Webinar for African Power Operators; Clean Energy Sector Investment Breakdown; This week's deepdive; Chart of the week; Research Radar and other published research.
LIVE WEBINAR: AFRICA POWER FINANCIAL PERFORMANCE BENCHMARK
On 30 July, David Oni and Joseph Ibeh will share insights from our benchmark of 26 power operators across 13 African markets (FY2021–FY2025, representing approximately US$28 billion in annual revenue).
The webinar will explore why some operators consistently outperform others despite operating in the same sector, challenging conventional assumptions about technology, scale and ownership. Drawing on evidence from across the benchmark, we'll show how who buys the power, how it is sold, and how revenues are collected shape the financial performance and bankability of power businesses across Africa.
2:00 PM WAT / 9:00 AM ET, live on Microsoft Teams. Register below.


CLEAN ENERGY SECTOR INVESTMENT BREAKDOWN
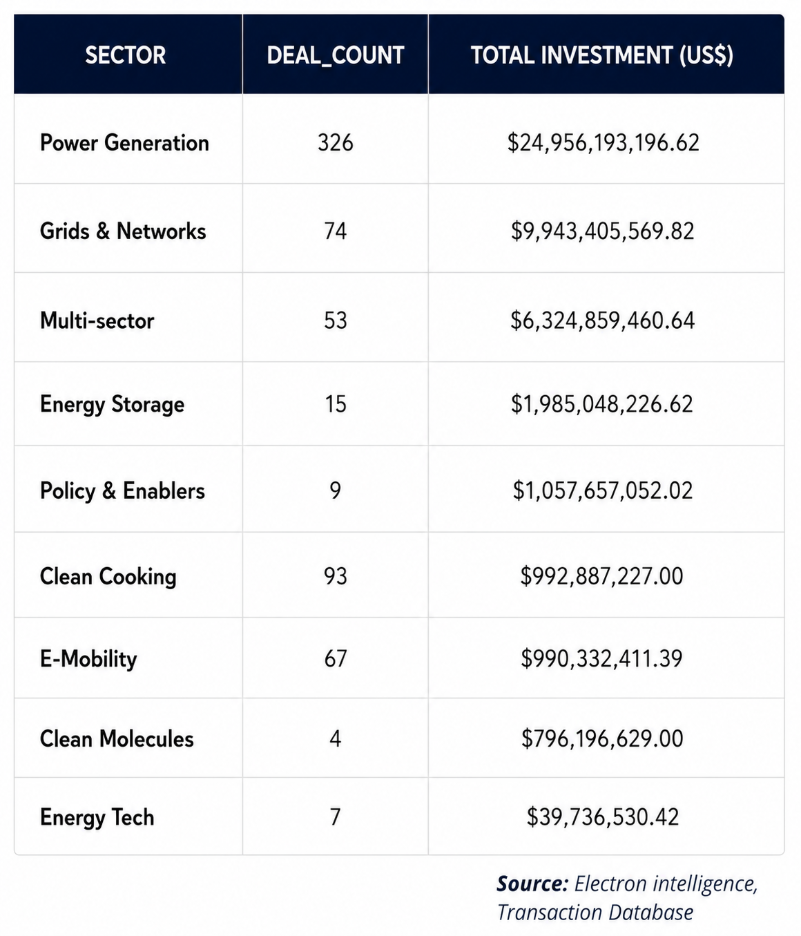
Investment distribution across tracked sectors in the EI database
Power Generation led both deal activity and investment, recording 326 transactions worth US$24.96 billion. Grids & Networks followed with 74 deals totaling US$9.94 billion, while Multi-sector projects accounted for 53 deals and US$6.32 billion in investment. Although Clean Cooking (93 deals) and E-Mobility (67 deals) ranked among the most active sectors by deal count, they attracted under US$1 billion each, highlighting the difference between transaction volume and capital deployed across sectors.
THIS WEEK'S DEEP DIVE
Kenya looks the cheaper place to import solar than South Africa, but the gap is mostly a tax refund
South Africa appears 13% more expensive than Kenya at the border. Once recoverable VAT is excluded, the difference shrinks to less than 2%, leaving South Africa marginally below Kenya.
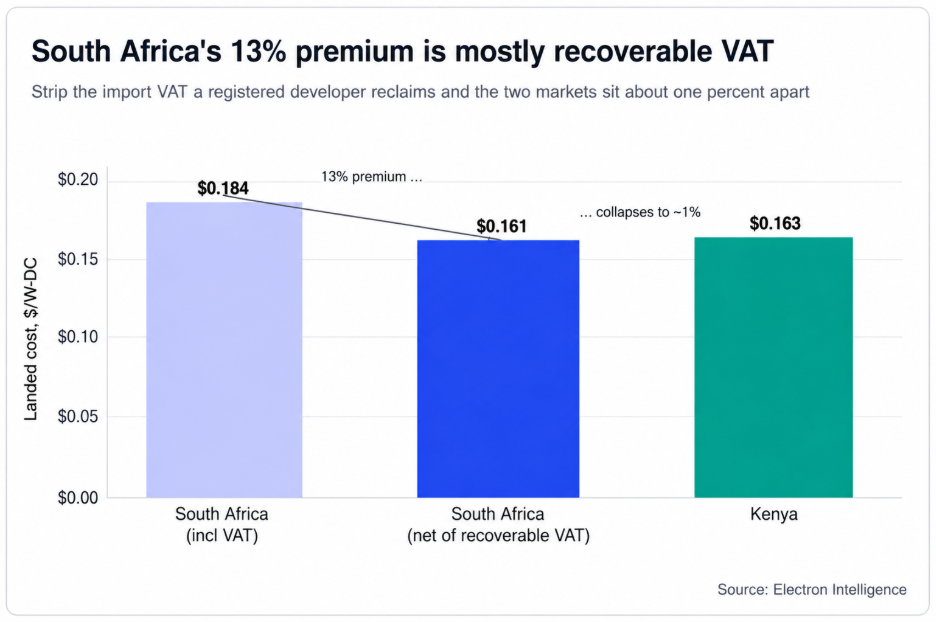
We modelled a theoretical 20 MW utility-scale solar project that imports identical modules and inverters from China into South Africa and Kenya under the same procurement and shipping assumptions. Although the equipment lands at $0.185/W in South Africa and $0.164/W in Kenya, most of the difference reflects South Africa's recoverable import VAT rather than a permanent increase in project cost.
Once recoverable VAT is excluded, the effective landed cost is $0.161/W in South Africa and $0.164/W in Kenya, leaving the two markets less than 2% apart. The remaining difference is explained primarily by freight costs and import policy, with South Africa's module duty offset by Kenya's higher freight costs and non-refundable import levies.
Read it here
CHART OF THE WEEK
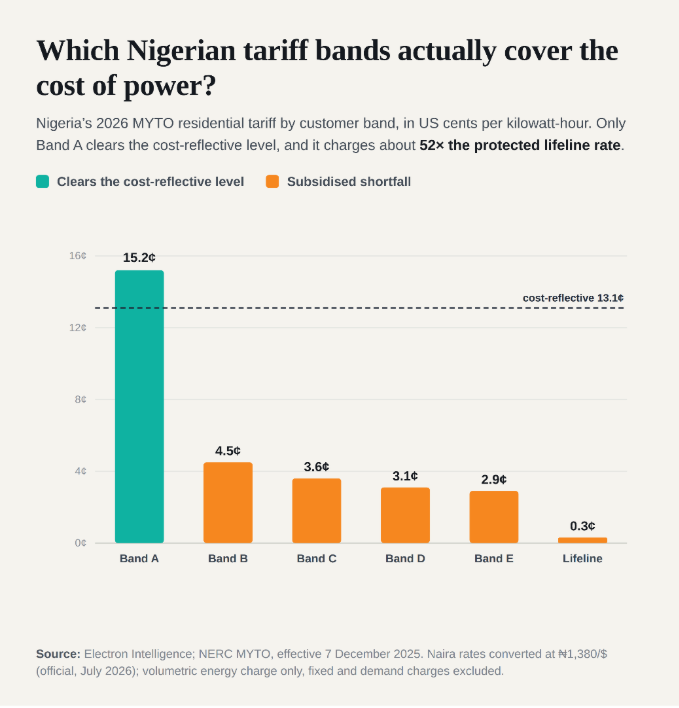
We analyzed residential electricity tariffs across Nigeria’s 2026 MYTO framework (effective December 2025/2026), comparing the volumetric charge per kilowatt-hour (US¢/kWh) for each customer band against the system’s cost-reflective benchmark.
Three patterns stood out:
- At 15.2¢/kWh, Band A is the only consumer class billed above the sector's cost-reflective benchmark of 13.1¢/kWh. Customers on this top band are guaranteed a minimum of 20 hours of daily supply and carry the burden of market viability and cross-subsidization across the grid.
- Subsidized shortfalls dominate Bands B through E: Under the 2026 MYTO schedule, tariffs for lower bands fall significantly short of cost recovery, ranging from 4.5¢/kWh (Band B) down to 2.9¢/kWh (Band E). This revenue gap creates a substantial shortfall that requires ongoing government subsidies to sustain distribution companies (DisCos).
- A 52-fold price spread between premium and lifeline tiers: The 2026 MYTO maintains a protected lifeline tariff of 0.3¢/kWh to cushion low-income households. This creates a 52× price disparity relative to Band A, reflecting the structural divide between commercial supply rates and social welfare pricing in Nigeria's power sector.
EI RESEARCH DESK
One thing that stood out to us this week.
Africa's most telling solar buyer this week was not a utility but an aluminium smelter. EgyptAlum signed a 25-year deal with Scatec's Dandara solar plant to reduce the carbon intensity of the aluminium it exports to Europe, where imports are subject to the EU's Carbon Border Adjustment Mechanism
Timothy Agbaje, Analyst
RESEARCH RADAR
Nigeria: NERC's Net Billing Regulations 2026, effective June, allow eligible self-generators (50kWp–1.5MWp) to export surplus solar power to their DisCo for bill credits at a regulated tariff. The scheme targets commercial and industrial users and is designed to reduce electricity bills rather than generate income, with state-level implementation likely to differ.
WeLight Targets 1 Million Solar Connections in $650M Four-Country Push. WeLight, a solar mini-grid developer currently operating in Madagascar and Mali, wants to put $450m into Nigeria and DR Congo and $200m across Madagascar and Mali, chasing 1 million connections by 2030 from about 65,000 today. The IFC became its first outside institutional investor earlier this year, but the CEO says only about half the funding will come from private and commercial sources, the rest from development-backed renewable programmes, the tell on how far private money alone reaches.
Kenya, the utility's monopoly on bulk supply is being prised open. The Open Access Regulations 2026 (Legal Notice 79, gazetted 8 May) let large consumers buy directly from generators and let IPPs wheel power across the grid for an EPRA-approved fee, eligibility starting at 1MVA on distribution or 10MVA on transmission. These industrial and commercial users are 70% of Kenya Power's sales (7,313 of 10,570 GWh, FY2025) and pay the premium tariffs that subsidise household power. We are watching whether they switch to cheaper direct renewables, which the World Bank warns could push domestic bills up as that cross-subsidy erodes.
Also Published
A Landed Cost Breakdown of Solar in Nigeria and What Sets the Price Jul 16
South Africa's Curtailment Surge Is Rewriting Which Renewables a Bank Will Fund Jul 09
The Wheeling Map: Where African Developers Can Sell Power Around the Utility, and at What Cost Jun 26
Wholesale to Retail: South Africa's Energy Capital After JETP Jun 18
Access the full platform
Coverage of Africa power and renewables markets. Live deal tracking, asset profiles, electricity pricing index, PPA tracker and contracted energy pricing, and the import tariff & VAT data for African markets. Request institutional access →