EI Research Brief
In this issue: Our maiden financial benchmark Webinar for African Power Operators; African power market activities in the last week; this week's deep dive; Chart of the week; Research Radar and other published research
LIVE WEBINAR: AFRICAN POWER FINANCIAL PERFORMANCE BENCHMARK
Yesterday we presented our new benchmark of 26 utility-scale power operators across 13 African countries, covering FY2021 to FY2025 and around $28 billion in combined annual revenue. Joseph and I walked through the economics of operating power in Africa and one pattern was prevalent: more than size, ownership, or grid exposure, the customer behind the cash flow is what separates the operators that can finance themselves from those that cannot.
If you missed the webinar or want to watch it again, you can access it on our youtube channel: https://youtu.be/FYVUEfxOTz8
MARKET ACTIVITY
The last week on the platform
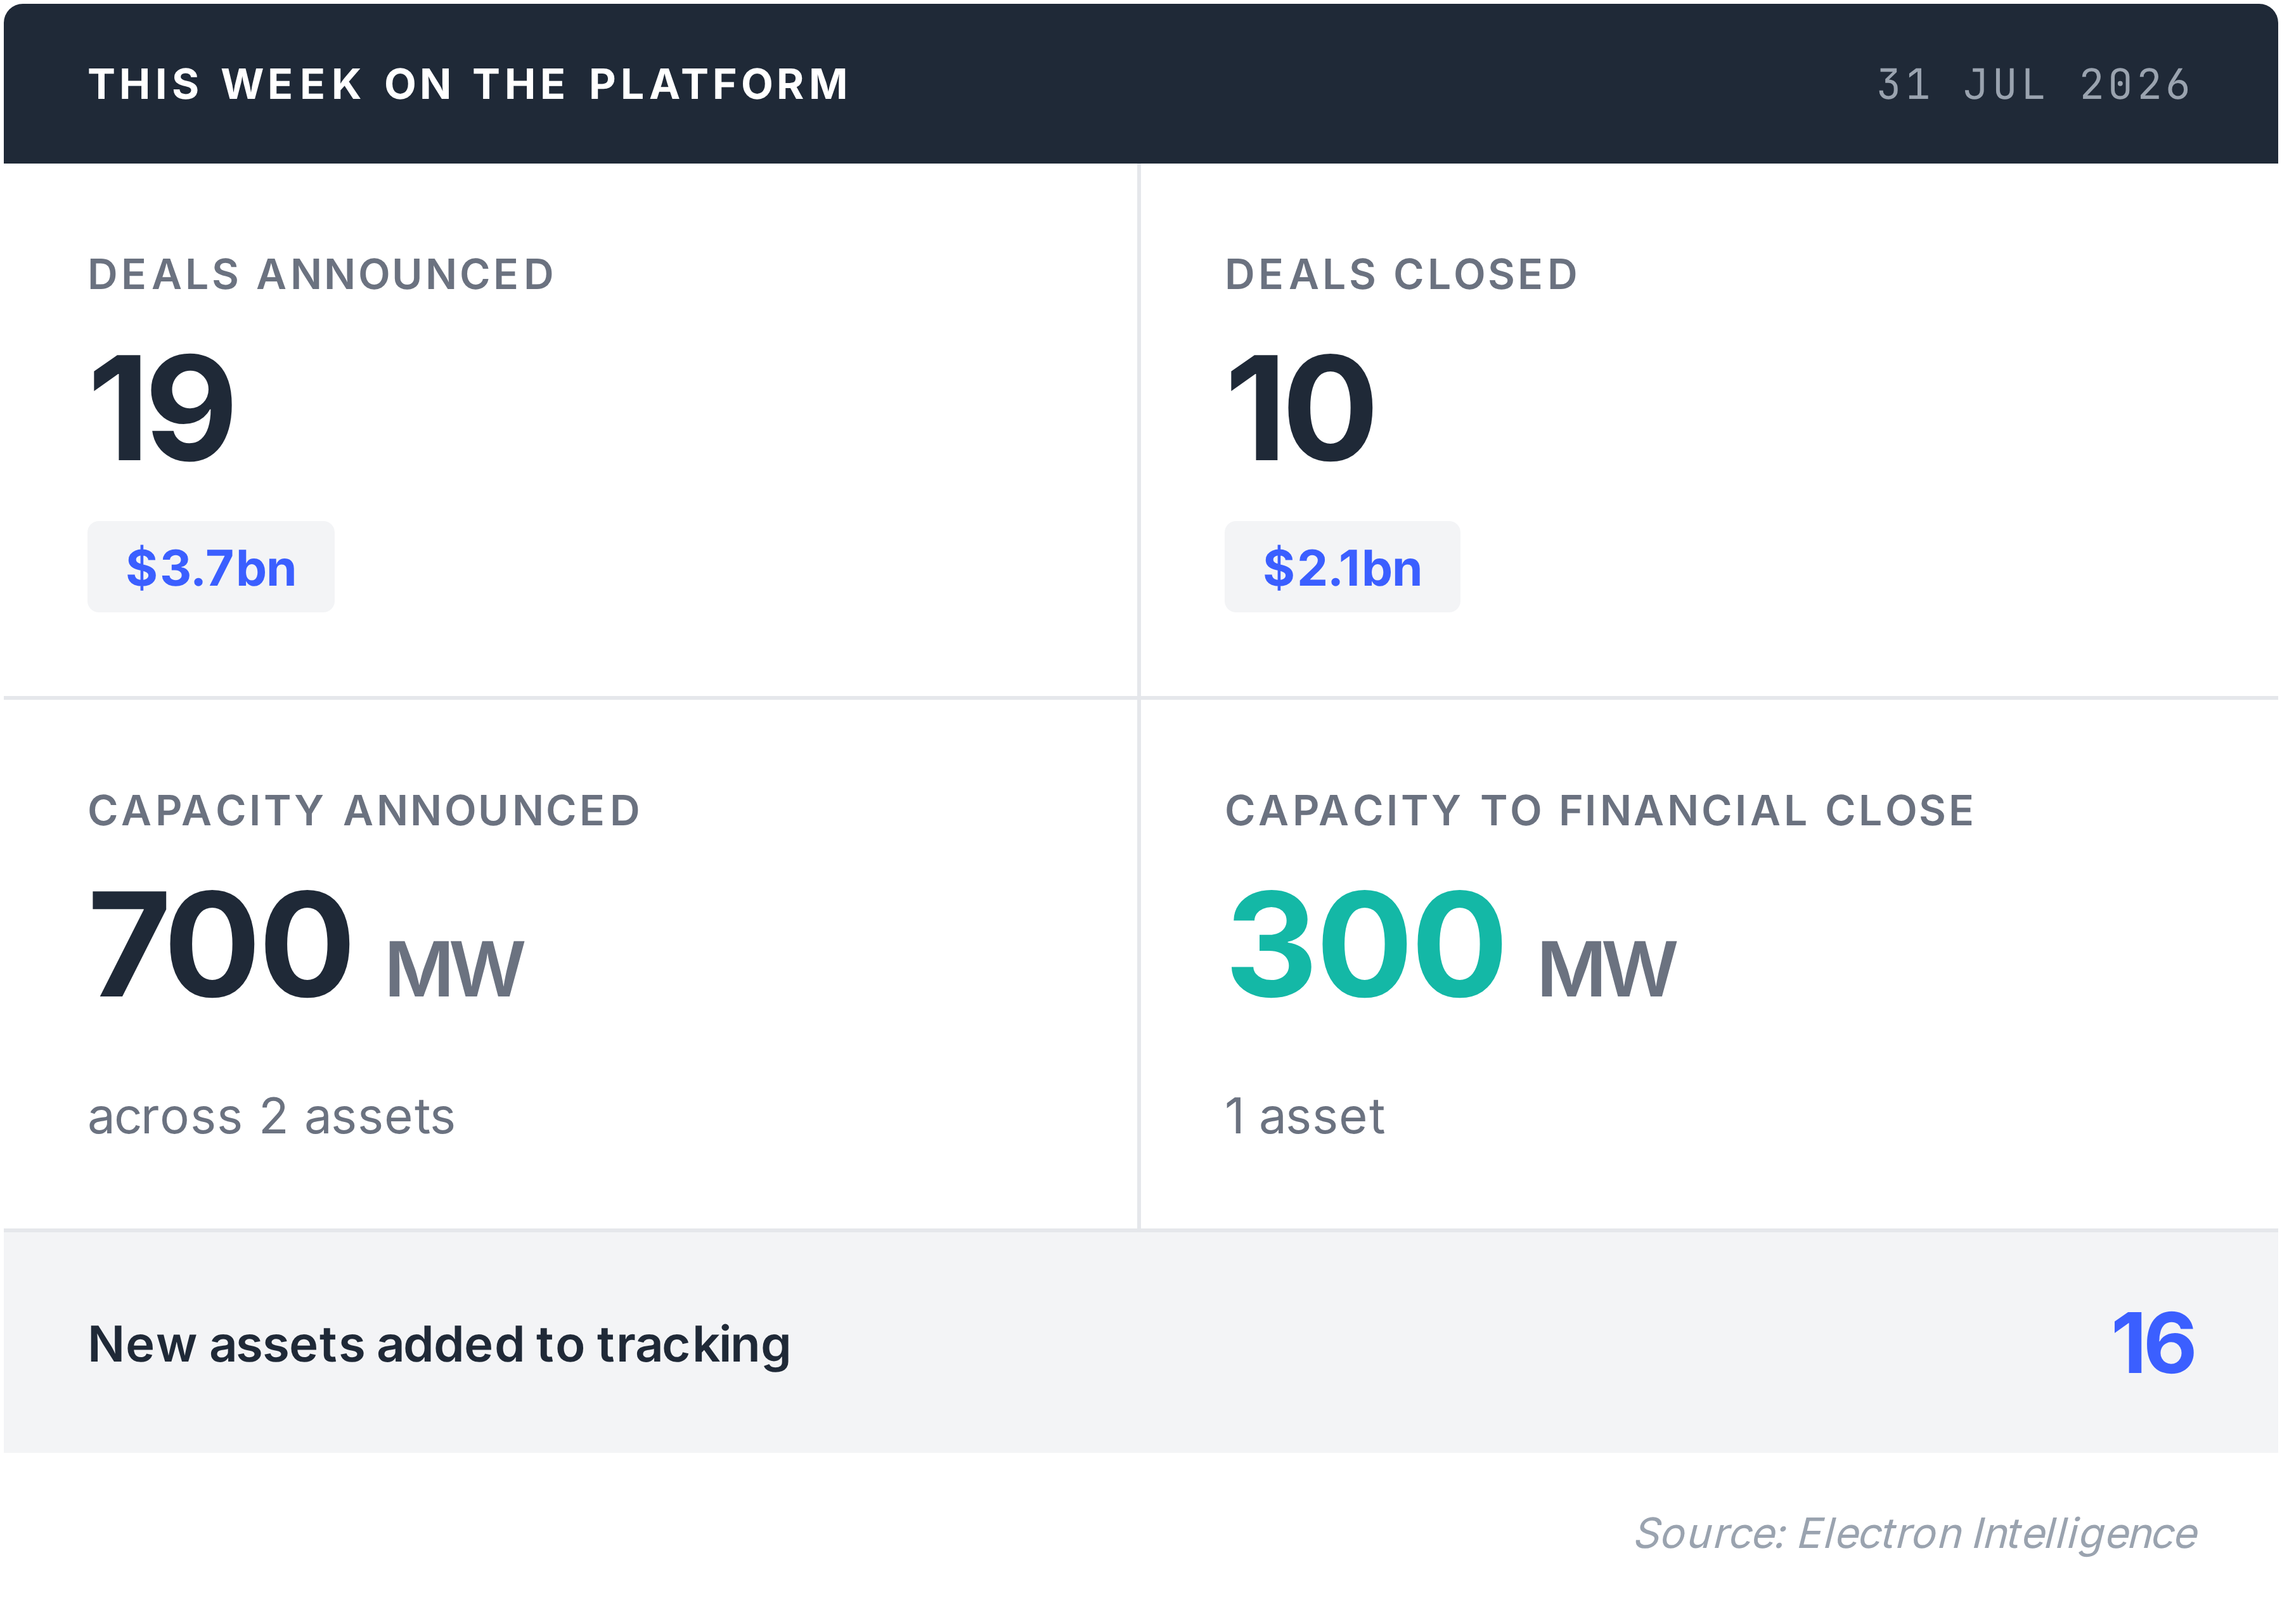
Activity remained robust over the past week, with 19 announced transactions valued at $3.7 billion, while 10 deals reached financial close, representing a combined value of $2.1 billion. During the period, 16 new assets were added to platform tracking, and 700 megawatts of generation capacity were announced across two assets. Of this, 300 megawatts, representing one asset, progressed to financial close.
THIS WEEK'S DEEP DIVE
What Drove Financial Performance Across Africa's Utility-Scale Operators
Building more generation capacity and transmission infrastructure did not consistently produce stronger financial performance across Africa's listed and state-owned power sector. Companies that expanded their asset base most aggressively often took longer to convert those investments into revenue and cash flow, while several of the strongest performers generated higher returns from infrastructure already in operation.
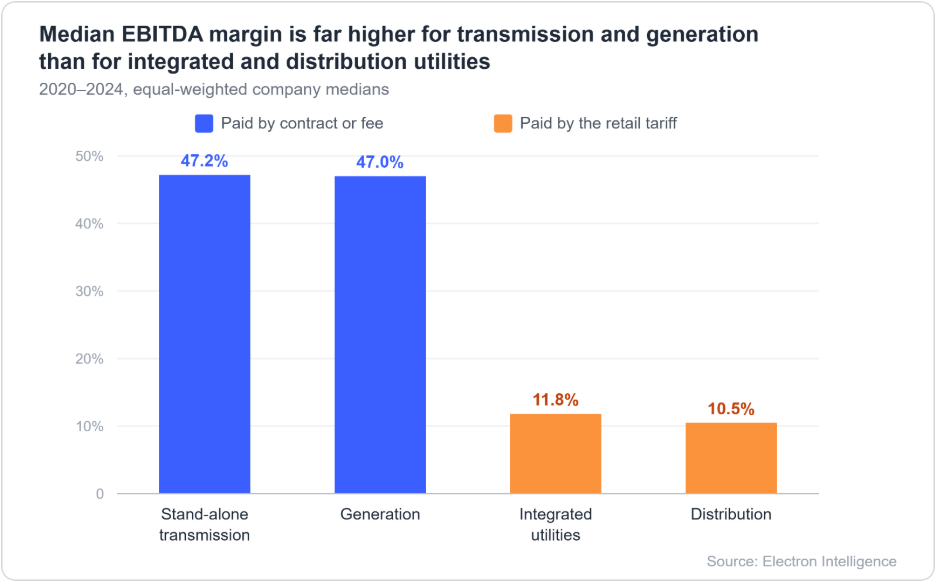
Our analysis of listed and state-owned power companies across multiple African markets shows that commercial arrangements, revenue productivity, capital structure and currency exposure explained financial performance more consistently than infrastructure expansion or ownership alone. Companies operating under stable contractual frameworks and generating more value from existing assets generally outperformed peers expanding generation and transmission networks. Meanwhile, exchange-rate depreciation significantly reduced the US dollar value of revenue growth in several markets, particularly in Nigeria, highlighting the importance of evaluating both local-currency and hard-currency performance.
CHART OF THE WEEK
Selected operators from our 26-company benchmark
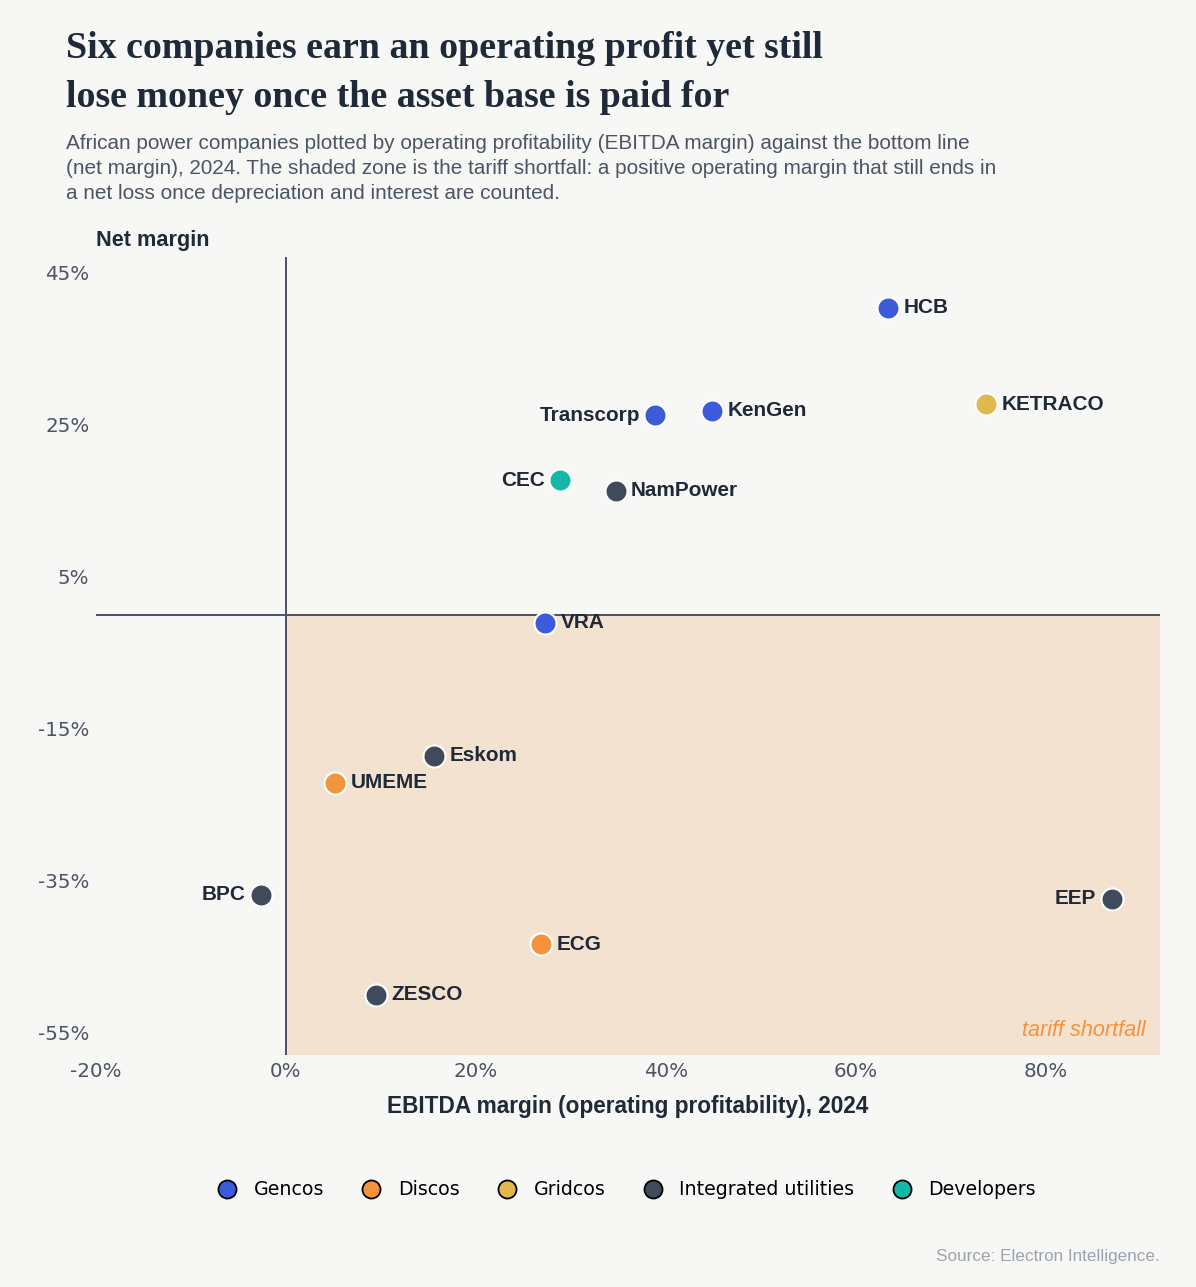
Three patterns stood out:
- Almost everyone passes the operating-profit test. Nearly every company sits to the right of zero: revenue covers cash operating costs across the board, whether it comes from a tariff, a PPA or a wheeling charge. The real dividing line is the vertical one, whether that same revenue also covers depreciation and interest on the asset base.
- Solvency fans out even where operating performance does not. Two companies can run almost identically at the operating line and still end up on opposite sides of the solvency line, one comfortably profitable, the other deep in loss. What separates them is the weight of depreciation and interest carried on that same revenue, more than how well they operate.
- What clears the full-cost test is revenue quality. The companies above the line do not form a cohort: a generator selling hard-currency contracted power (HCB), a transmission link tied to an industrial anchor (MOTRACO¹), a developer supplying the mines (CEC). What they share is a customer that pays commercially and in hard currency. The largest state distributors and utilities, leaning on weaker domestic demand, are the ones that fall short.
EI RESEARCH DESK
One thing that stood out to us this week.
South Africa took three steps on transmission this week. On Wednesday Cabinet released the Revised Electricity Pricing Policy for public comment, which unbundles tariffs across generation, transmission, distribution and retail. On Thursday the Eskom Restructuring Task Team presented its Phase I report to the President, and today he endorsed it. According to the report, separating transmission from Eskom is feasible without compromising Eskom's financial sustainability. Separation has been law since 2024, but this is the first feasibility analysis to be endorsed. The entity now has a name, Transmission System Operator SOC Ltd (TSO), and decisions on transmission network access are to move to the NTCSA before the TSO exists.
Grid access decisions shift to a ring-fenced entity outside the generation business, which is the constraint most projects are queued behind. And the restructuring splits Eskom's credit rather than repairing it. The transmission network leaves with a regulated revenue line and a mandate to fund the Transmission Development Plan. Generation and distribution stay with Eskom, and so does the municipal arrear debt. Who carries non-payment risk in the restructured market is unresolved. The report lists clarifying the payment waterfall among its immediate actions.

David Oni, Head of Research
RESEARCH RADAR
New reports, market moves, deals, and policy shifts we're tracking across the 54 markets.
South Africa secured a $1.5bn World Bank loan behind its energy reforms. The development policy loan, signed 21 July, supports the energy and transport overhaul, with the Bank noting private renewable investment has tripled since 2023. It is the fourth such loan since 2022, as Pretoria unbundles Eskom and opens the grid to private power. We are watching whether concessional money like this speeds the transmission build the renewables pipeline is waiting on.
Nigeria pulled $155m into distributed solar in a single week. The Rural Electrification Agency (REA) anchored an $80m debt facility for off-grid solar home systems and business power, plus a $75m smart-battery programme with UK-backed MOPO. It underlines Nigeria's standing as the continent's largest and fastest-growing distributed-solar market. We are watching whether off-grid capital keeps compounding while the grid-tied sector stays stuck on subsidy and debt.
South Africa moved a step closer to a competitive power market. NERSA extended its consultation on new electricity trading rules to 28 August, the framework that will let generators and traders sell to multiple buyers instead of only a single utility. We are watching whether the rules give private renewables a real route to market beyond single-buyer PPAs.
Also Published
A Landed Cost Breakdown of Solar in South Africa and Kenya, and What Sets Them Apart Jul 23
A Landed Cost Breakdown of Solar in Nigeria and What Sets the Price Jul 16
South Africa's Curtailment Surge Is Rewriting Which Renewables a Bank Will Fund Jul 09
The Wheeling Map: Where African Developers Can Sell Power Around the Utility, and at What Cost Jun 26
Access the full platform
Coverage of African power and renewables markets. Live deal tracking, asset profiles, electricity pricing index, PPA tracker and contracted energy pricing, and the import tariff & VAT data for African markets. Request institutional access →