South Africa’s Curtailment Surge Is Rewriting Which Renewables a Bank Will Fund
South Africa's renewable programme rests on a twenty-year take-or-pay contract that shifts curtailment risk from the developer to Eskom. It is a take-or-pay deal, which means Eskom pays a plant for the energy the grid tells it not to send, with that reimbursement sized for curtailment of about four percent. But in the first half of 2026, Eskom curtailed independent producers roughly ten times the volume of all of 2025, far past that four percent. Reimbursement has also slipped; payments that once took three to four months now take nine or more, and a backlog of nearly $60 million (about a billion rand) has built up. The risk the contract was meant to absorb has landed back on the generator.
We priced six ways of building and selling power against that curtailment. What decides bankability is how a project's contract treats the energy it cannot sell, and with three-quarters of the cost borrowed, a small revenue gap becomes a large one in whether the loan is covered. Four of the six no longer clear it. Only the wheeled contract stands on its own.
Contract | What it entails |
Wheeled contract | a corporate buyer takes power across the grid from an independent plant, with curtailment risk negotiated deal by deal. |
Standalone battery | stores curtailed energy and sells it later. |
Take-or-pay plant | Eskom reimburses curtailed energy, capped at the design level and paid with a delay.
|
Solar firmed with a battery | output partly reimbursed, partly stored and resold.
|
Part-merchant hybrid | part of the output is contracted and reimbursed, part is sold into the open market. |
Pure-merchant plant | sells only into the open market and is paid nothing for curtailed energy.
|
Executive summary
- Under today’s curtailment, the projects that clear are the ones whose contract pays for curtailed energy or the flexibility to store it and sell it later. On merchant terms, almost nothing clears.
- A small effect, amplified by a large one. The energy lost between the four percent a plant is paid for and the ten percent it now faces costs well under a percentage point of return and more as curtailment climbs past the cap. Debt does the amplifying: with about three-quarters of the project borrowed, how each contract handles that lost energy turns a thin revenue gap into a wide one in equity returns.
- Only the wheeled contract stays fundable on its own, and even that rests on revenues rising about two percent a year in real terms; if revenues don’t meet the 2 percent growth, the wheeled contract slips under too. The take-or-pay plant is marginal.
- Everything else falls short on merchant terms: solar firmed with a battery, the part-merchant hybrid, the pure-merchant plant, and the standalone battery. The battery and the firmed-solar plant clear only once a contract pays for their flexibility, through a capacity payment or a dispatchable tariff, not on the open market.
- The counterintuitive part is where the risk actually sits. Selling into the open market, the fix most often proposed for curtailment, is the weakest place to be. In the model’s high-stress case, eighteen percent curtailment with depressed prices, the pure-merchant plant’s equity return collapses to about minus twenty six percent.
Curtailment Has Risen Tenfold Because Grid Capacity Hasn't Kept Pace
Curtailment is happening because South Africa has connected more generation than its grid can carry. It will not clear with better weather or a repair; the constrained corridors in the Eastern and Western Cape stay that way until new transmission lines are built. The problem is regional, and is worst where the best sun and wind sit farthest from demand, and made worse by must-run coal and a midday solar glut.
The national transmission company of South Africa (NTCSA) schedules most of the new lines for 2028 to 2034. They need environmental approval, land, and long lead times that cannot be rushed. That is what makes the problem lasting, and why a 2026 curtailment figure tells a lender to expect similar exposure for years.
Curtailed volume in the first half of 2026 was roughly ten times all of 2025. The framework that governs it, in force from April 2025 to March 2028, permits curtailment of up to 10% in the constrained corridors while paying for only 4%. The first-half volumes suggest realised curtailment is pressing toward that ceiling, though per-connection figures are not yet public.
Producers are already reporting revenues about nine percent below budget, partly from the energy they could not sell and partly from the wait to be paid for it. Curtailment is climbing fast and will not ease for years, and the response is only beginning to show in what gets built: batteries and wheeled contracts are gaining ground, even as new solar is still bid as though curtailment sat at four percent.
Curtailment is also the price of connection, not only a loss on it. Eskom’s 2025 capacity assessment found no room in the Cape corridors at all; it was the ten percent curtailment allowance that freed roughly 3,470 megawatts to connect. For a developer there, the alternative to a curtailed project is not an uncurtailed one; it is no project. The question is whether curtailment is priced correctly, not whether it should exist.
Recent Deals Show How the Market Is Already Pricing Curtailment Risk
Bid Window 7, the latest round of the South African government’s renewable auction, awarded 1,760 megawatts to eight solar projects at tariffs between about $0.025 (R0.42) to $0.030 (R0.49) per kilowatt-hour. The round is a test of whether new build is still priced as though curtailment sits at four percent, and two details suggest it has not caught up.
The tariffs are close to the previous rounds. And the wind capacity on offer came in undersubscribed and was moved to an oversubscribed solar category, with the best wind sites sitting in the same grid-constrained Cape corridors. The constraint that drives curtailment is already reshaping what gets built, even where the bids do not yet price it.
The battery programme shows the other side. Its first window awarded five projects; among them Red Sands, at 153 megawatts and 612 megawatt-hours, the largest standalone battery on the continent to reach commercial close. Red Sands does not live off the spot market. It is paid a capacity fee, an energy charge, and payments for grid-support services on a fifteen-year contract with the national transmission company. Priced on merchant trading alone, our model finds a standalone battery does not clear; it is the contract that makes it bankable.
A wheeling deal shows how curtailment risk is written when no take-or-pay stands behind it. SOLA’s Springbok project in the Free State, Africa’s first multi-buyer wheeling plant, began operating in October 2025 and sells its 195 megawatts across corporate buyers, among them Amazon, Sibanye-Stillwater, Sasol and Vodacom, over the grid rather than to Eskom. With no reimbursement behind the contract, who bears the loss when the plant is curtailed is settled in the private agreements, buyer by buyer, which is the allocation the wheeled model assumes.
Between the contracted structures and the pure-merchant plant sits the hybrid: part contracted and reimbursed, part sold into the market, protected only on the contracted slice. No single recent deal defines it cleanly; it is what a developer lands on when only part of the output can be contracted.
How Curtailment Reprices Returns Across the Six Models
Priced against the curtailment occurring, the six models separate cleanly. The separation comes down to one thing: whether the contract prices the curtailed energy.
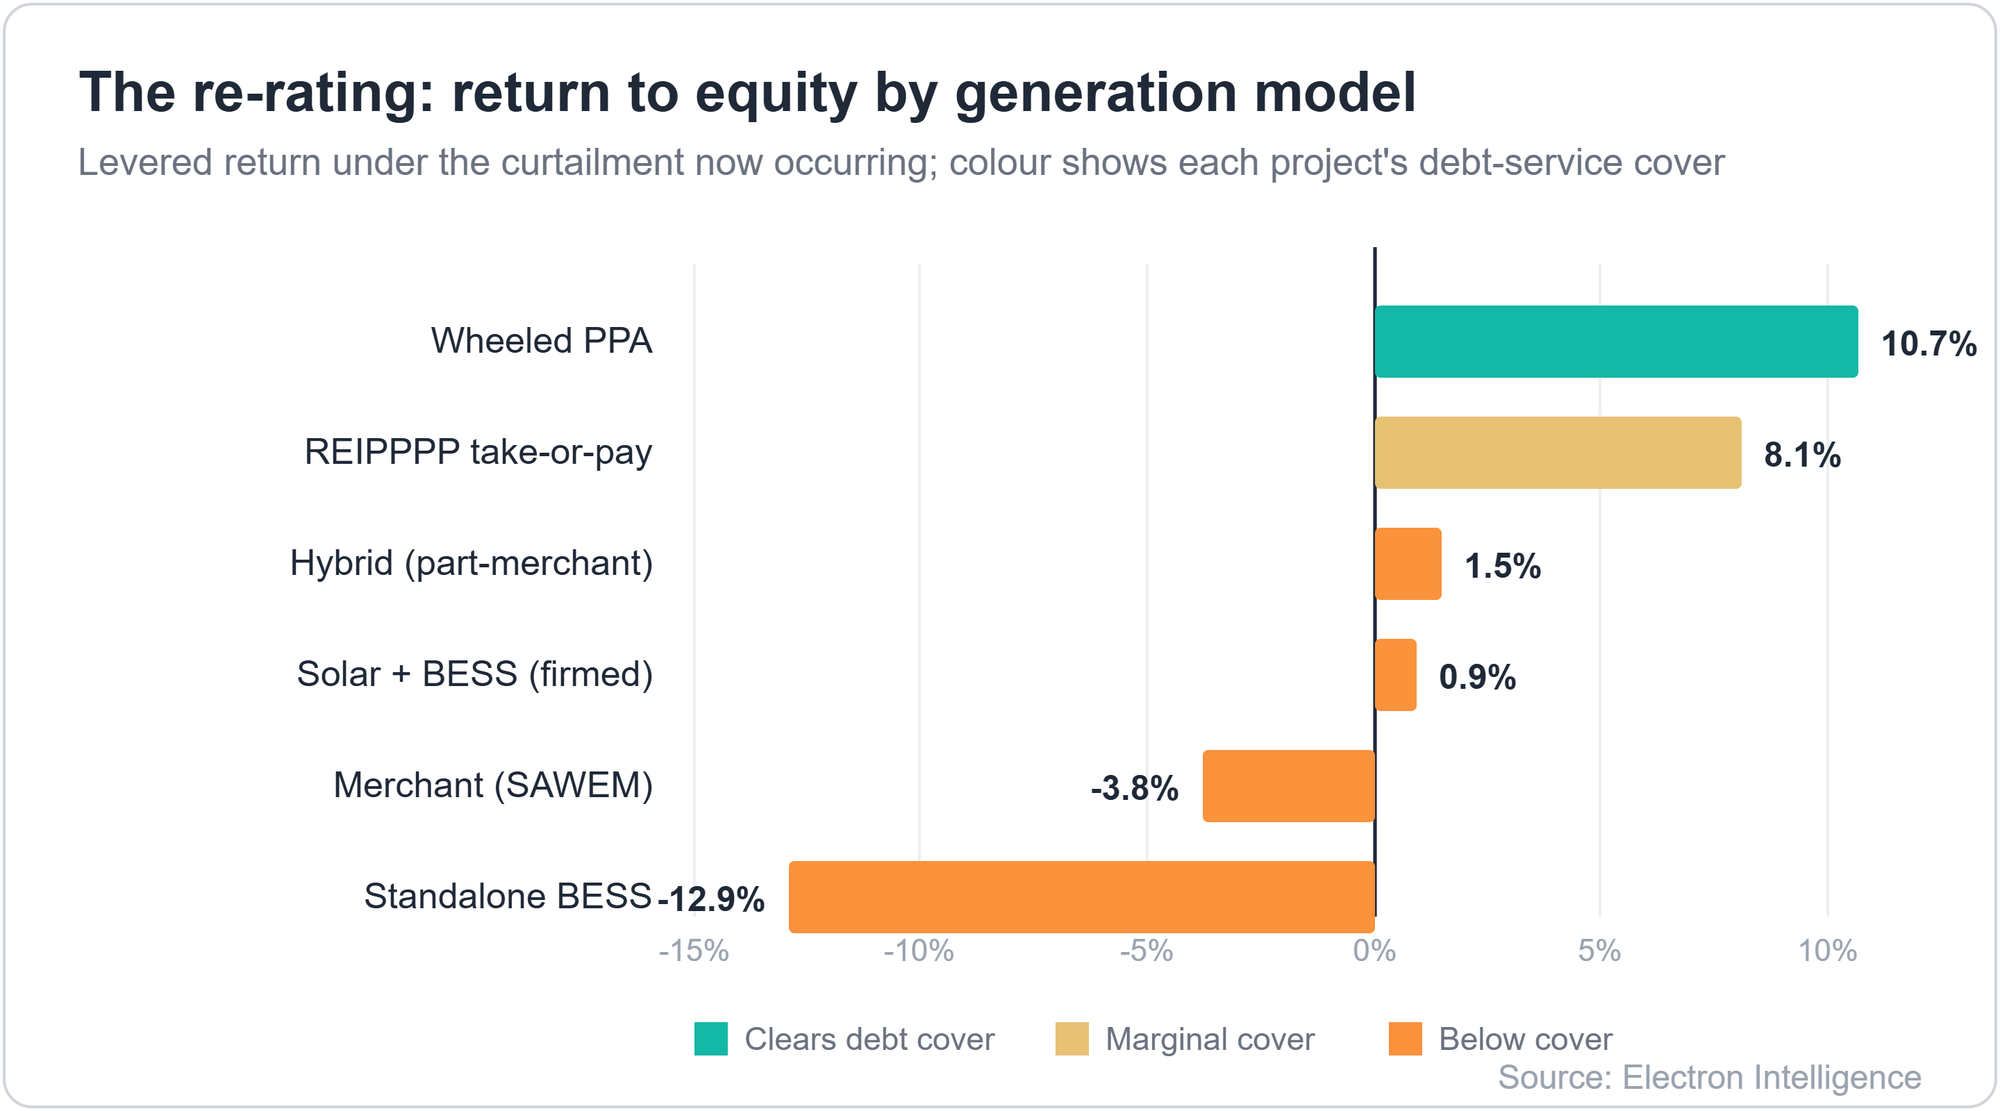
Figure 1: levered return to equity by model, colored by whether the project clears. Contracted structures cluster at the top, merchant exposure at the bottom.
Return on equity splits the six sharply, as the chart shows below. Only the wheeled contract clears comfortably, at about 10.7 percent; the take-or-pay plant is marginal at 8.1. Everything on merchant terms falls short or loses money: solar-plus-battery under one percent, the hybrid 1.5, the pure-merchant plant minus 3.8, and a standalone battery minus 13, which turns bankable only on the kind of capacity contract Red Sands secured. The returns that clear come from the contract that prices curtailed energy, not the technology.
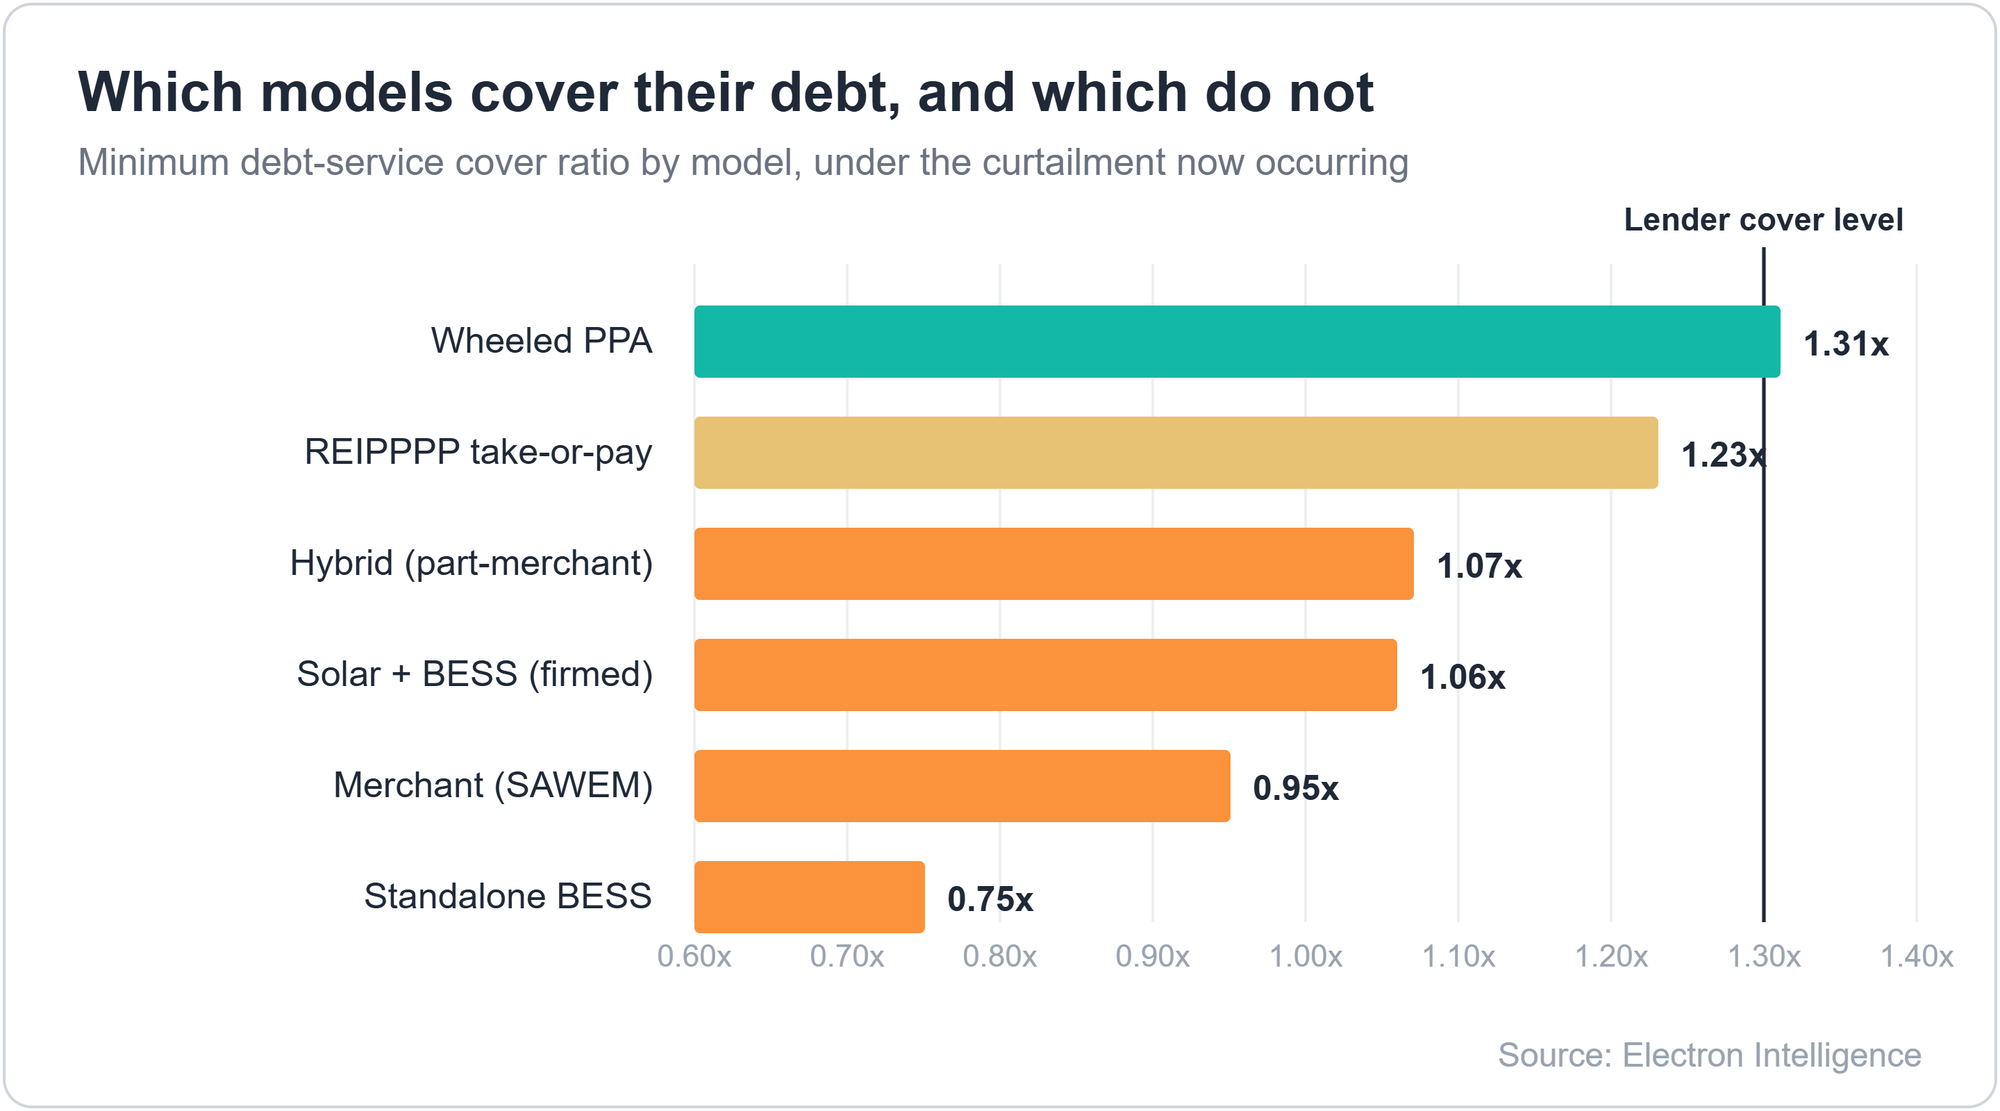
Figure 2: minimum debt-service cover ratio by model under the curtailment now occurring.
The debt-service cover ratio, the cash a project throws off for each rand of debt due, tells the same story; lenders want it comfortably above 1.2 to 1.3 times. Only the wheeled contract clears, at 1.31, with the take-or-pay plant closest at 1.23. On merchant terms, the rest fall short, from about 1.06 down to the standalone battery at 0.75. Because these projects carry heavy debt, small revenue gaps swing equity returns hard, which is why the spread is so wide.
Two of the models that fall short do not collapse as curtailment worsens, and the reason is built into their contracts. The take-or-pay plant is still reimbursed for curtailed energy up to the %4 cap, which puts a floor of guaranteed revenue under the loss. The firmed-solar plant stores the energy it is told not to send and sells it later, so those megawatt-hours are shifted in time rather than forfeited. Both catch part of what a pure-merchant plant simply loses, so the two settle just below the funding line, around 1.23 and 1.06 times cover against a lender's 1.3, marginal rather than unbankable.
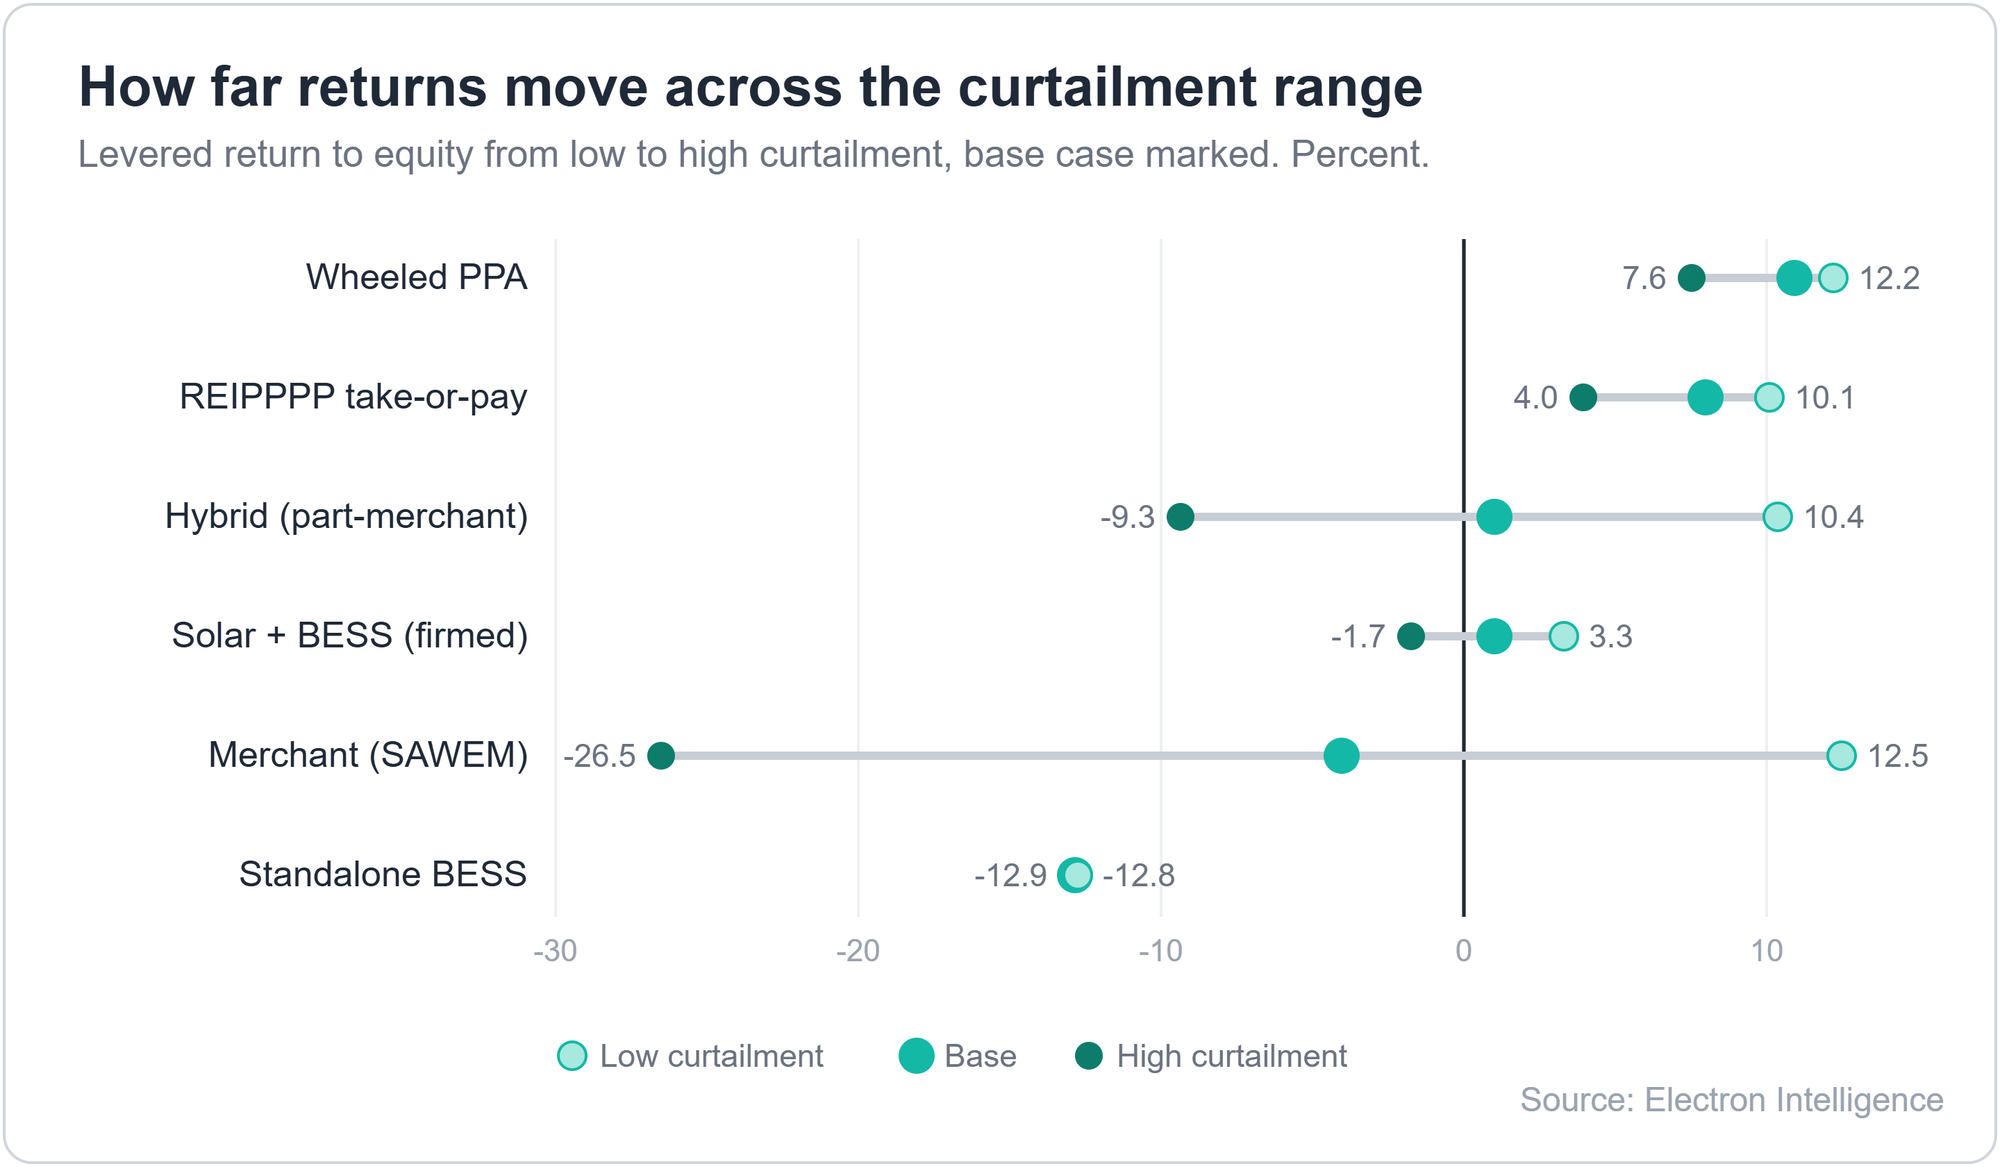
Figure 3: how far returns move from low to high curtailment, by model.
That narrow margin is exactly the point. Because these two miss the line by so little, a small amount of support tips them over it: protection against the reimbursement delay, a guarantee on the curtailed volume, or debt priced a touch cheaper. This is the zone where the contract, and the capital willing to stand behind it, decides the outcome. The wide split is not about the size of the curtailment. It is about how each contract treats the curtailed energy, magnified by the debt each plant carries, and it grows as curtailment worsens.
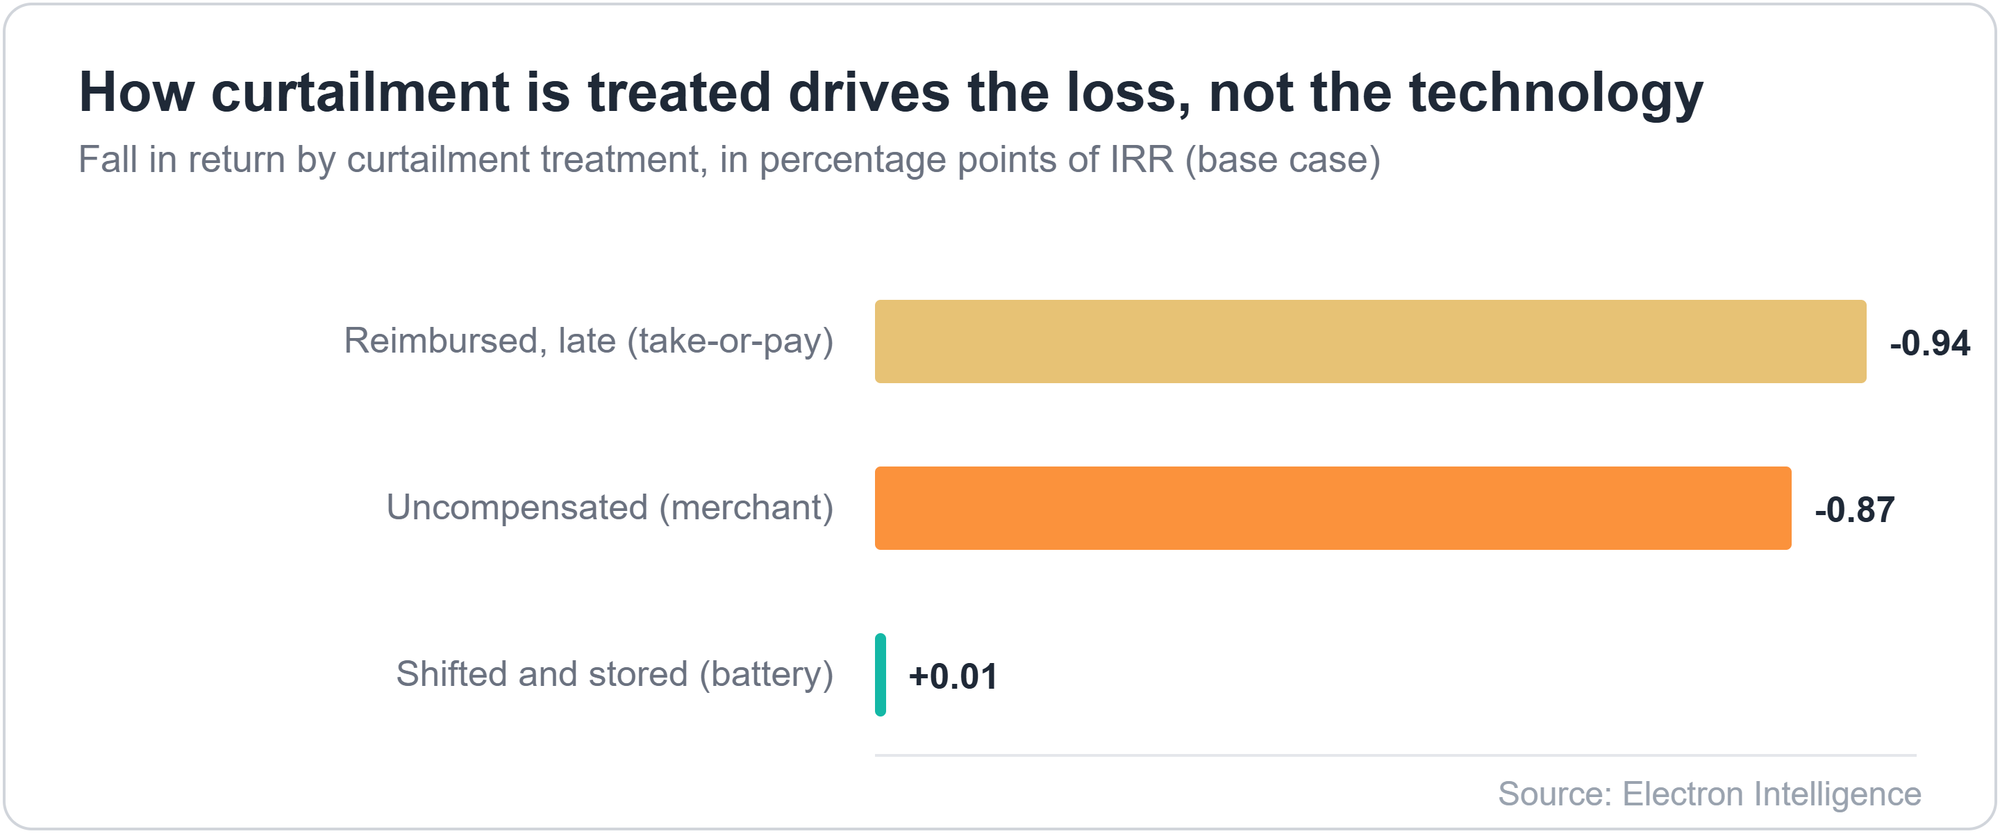
Figure 4: Return lost by how curtailed energy is treated, whether paid nothing, reimbursed late, or stored.
Only storage protects a plant: a battery-firmed project loses almost nothing as curtailment climbs. The merchant and take-or-pay plants both lose about a percentage point today and climb toward two or more under stress. And because the take-or-pay plant is fully contracted and fully exposed, the high-value energy it loses above the four percent cap is the largest of any model, so the plant the framework was meant to protect is hit hardest.
The finding could narrow if the wholesale market opens on schedule and prices settle higher; the merchant plant recovers ground. If the grid-service and capacity markets a battery needs open and pay well, the standalone battery clears on its own. If the grid is built faster, curtailment eases. And one assumption that does much of the lifting is that the model credits revenues with two percent real growth a year, and at zero even the wheeled contract slips below the line.
What is structural is narrower than it looks. Curtailment is not the anomaly; every grid that scales wind and solar, from California to Chile, curtails and manages it. What is unusual in South Africa is the missing market to sell curtailed energy into and the compensation that lags it. So, the durable thing is the mispricing, not a permanent re-rating to contracted structures alone, and it starts to close as the market opens and the framework is reviewed in 2028.
What Decides It: The Curtailment Clause
Our six models share the same costs, capex and financing, and differ in only one thing: how each treats the energy it is curtailed, whether it is reimbursed, stored, or written off. The wide spread in their returns comes from that difference alone. In a real project, that treatment is written into the contract, in the terms that decide who bears the loss when the plant is stopped and how the compensation cap and payment delay are handled. Those are the terms a lender studies hardest, because the loan is repaid only from the project's own revenue.
The same terms matter to three parties: the developer negotiates them, a commercial bank decides whether to lend against them, and a development-finance institution decides whether to stand behind them. On our numbers, it is that treatment of curtailed energy, more than the technology, that moves a project across the funding line.
Together, those terms are the curtailment clause, and it is what separates the six models. A wheeled contract clears because it hands the loss to a counterparty. A pure-merchant plant does not, because it leaves the loss unpriced. A battery or firmed-solar plant sits between, bankable only once a capacity payment or dispatchable tariff pays for the flexibility it was built with. Physical flexibility does not fund a project; the clause that prices the curtailed energy does.
The developer is the one who drafts that clause, which is why it matters as much to them as to the capital side. Their job is to write it, so the loss is absorbed or contracted rather than borne in full: storage to shift the curtailed energy, a dispatchable or wheeled offtake to contract it, oversizing to dilute it. Two terms carry the risk: who bears the loss when the plant is told to stop, and what protects against the payment delay and the four percent cap. Those are the lines to change in the next term sheet.
The same clause is the whole of the capital side’s job. In South Africa, the lender that decides is a commercial bank, not a development institution: the five big domestic banks provide the debt, and their roughly 1.3x coverage ratio benchmark is that clause run through a debt model. A development-finance institution, or DFI, comes a step behind, not as the main funder but the catalytic one: it backstops the curtailment loss or guarantees the reimbursement, so the banks keep lending through the transition. Its value added is the clause, not the cheque.
What remains is calibration: the precise storage a specific project needs to clear the funding line, and the counterparty credit a wheeled contract needs to price the loss. Both are contract questions, not questions about the technology.
The Regulatory Dates and Rulings That Will Move These Numbers Next
The wholesale market opens in the third quarter of 2026, and its early prices will show whether merchant generation has any floor when coal still sets the price. The framework is reviewed in 2028, when the four percent cap can be raised or held. Substation completions will set when curtailment begins to ease. A ruling is pending on Eskom’s position as both curtailer and competitor. And the next auction will show whether new build finally prices the curtailment it faces.
Bottom Line
Curtailment has moved the test of a bankable renewable project in South Africa from the plant to the contract. While the framework pays for four percent and the corridors curtail ten, with no market yet to sell the difference into, only the structures that price that gap clear a lender's debt coverage test: a wheeled offtake, a capacity payment, a reimbursement backed by a guarantee. The dislocation closes as the wholesale market opens this year and the four percent cap comes up for review in 2028. Until then, the return goes to whoever prices the toll correctly and holds through the repricing, and the loss to whoever keeps building as though the shield still worked.
Beyond South Africa, the same pressure is forming wherever renewable build has outrun transmission, and the markets that drew independent producers fastest, in East and North Africa, are the ones to watch for the same wall. South Africa reached it first, and is the clearest place to read what happens next.