The Capital Structure Behind Africa’s Remote-Mine Energy Transition.
Africa's Remote Mines Cut Diesel With Their Own Balance Sheets. The Next Wave Needs Project Finance
EI tracks 2,159 megawatts of contracted captive renewable capacity at African mining operations across 23 disclosed projects. This first installment of a three-part series examines the 213 megawatts at remote off-grid mines, where the cost case for renewables is closed, and the capital structure behind the build determines whether it scales.
Six listed-company mining operations across Mali, Senegal, the Democratic Republic of Congo (DRC), and Madagascar have commissioned solar-dominant hybrid captive systems over the past five years, totalling 213 megawatts. Four were paid directly from the mining companies’ balance sheets. Two were structured as build-own-operate transactions: Aggreko’s 16-year design-build-operate-maintain contract at Resolute’s Syama mine in Mali, and CrossBoundary Energy’s platform deal at Rio Tinto’s QMM mineral sands operation in Madagascar. This article examines how the next wave will be financed.
Executive Summary
- The build is happening at scale. EI tracks 2,159 megawatts of contracted captive renewable capacity at African mining operations across 23 disclosed projects, spanning three distinct drivers. This article covers the 213 megawatts at six remote off-grid mines.
- The cost case is settled. Solar-plus-storage crossed below diesel on a levelized cost basis across African frontier geographies, and the 2022 oil shock turned the diesel premium into a permanent feature of the cost stack.
- Four of the six projects were balance-sheet-funded. Barrick, B2Gold, Endeavor, and the Barrick / AngloGold joint venture at Kibali financed builds directly from corporate balance sheets. At sector-benchmark capital costs of USD 1.2 to 1.5 million per megawatt, the balance-sheet-financed 165 megawatts represents approximately USD 200 to 250 million of capital absorbed onto mining balance sheets.
- Two build-own-operate structures, two different capital models. Aggreko holds the generation asset at Syama under a 16-year design-build-operate-maintain contract with Resolute; Resolute pays for power delivery. CrossBoundary Energy holds the generation asset at QMM under a 20-year power purchase agreement with Rio Tinto and finances it through a platform-level capital stack. The two structures attract different capital and replicate under different conditions.
- Capital structure is the forward question. Scaling the build at the disclosed balance-sheet financing pattern is not a realistic capital-allocation path for the listed-company miners involved. EI’s broader registry tracks a further 1,946 megawatts in pipeline across Parts 2 and 3 of this series. The CrossBoundary platform is the only off-balance-sheet capital stack assembled at scale for this asset class so far.
Three Drivers, One Article’s Scope
Mining-sector decarbonisation covers several distinct investment decisions. EI’s tracking of 2,159 megawatts of contracted captive renewable capacity across 23 African mining projects identifies three drivers, each shaped by different commercial logic.
The first, and the focus of this article, is operational necessity at remote off-grid mines. For operations built where no national grid reaches, the only emissions vector that can be cut is on-site diesel combustion. The 213 megawatts examined here, across six operations in four countries, falls into this category.
The second driver, covered in Part 2 of this series, is the carbon intensity of purchased grid electricity at mines that are grid-connected. The largest concentration is in South Africa, where corporate power purchase agreements and wheeled arrangements account for the majority of the 309 megawatts in pipeline for that instalment.
The third driver, covered in Part 3, is end-market regulation. The European Union’s Carbon Border Adjustment Mechanism, the US Inflation Reduction Act’s critical-minerals provisions, the EU’s Critical Raw Materials Act, and offtake clauses from battery-cell manufacturers each price the embedded carbon content of mining output at the customer’s border.
Readers familiar with the Greenhouse Gas Protocol will recognise these as Scope 1, Scope 2, and end-market-driven Scope 3 pressure. Scope 1 covers direct emissions from sources the company controls, including on-site diesel generation. This article concerns Scope 1.
The Cost Crossover That Made Diesel Indefensible
The economics of captive power at remote mine scale changed as two input costs fell: solar photovoltaic generation through the 2010s, and battery storage in the early 2020s. The combination of solar generation and storage large enough to handle overnight and peak demand has crossed below diesel on a levelized cost basis across most African frontier geographies. Industry estimates for diesel-generated power at remote African mines range from USD 0.15 to USD 0.50 per kilowatt-hour, depending on distance from fuel supply. Solar-plus-storage hybrid systems in comparable geographies are being built at USD 0.06 to USD 0.20 per kilowatt-hour on a levelized basis. The crossover is wide.
Two factors compound it in landlocked markets. Diesel in Mali or the DRC carries transport and logistics costs on top of the base commodity price. The 2022 oil shock made the premium visible in its sharpest form: the World Gold Council placed industry-wide all-in sustaining costs at a record USD 1,289 per ounce in the second quarter of 2022, up 18 per cent year on year, with energy as the dominant cost driver. Operations with fixed captive power costs were insulated from the move; diesel-dependent ones absorbed the full commodity movement. The case hardened then and has not reversed.
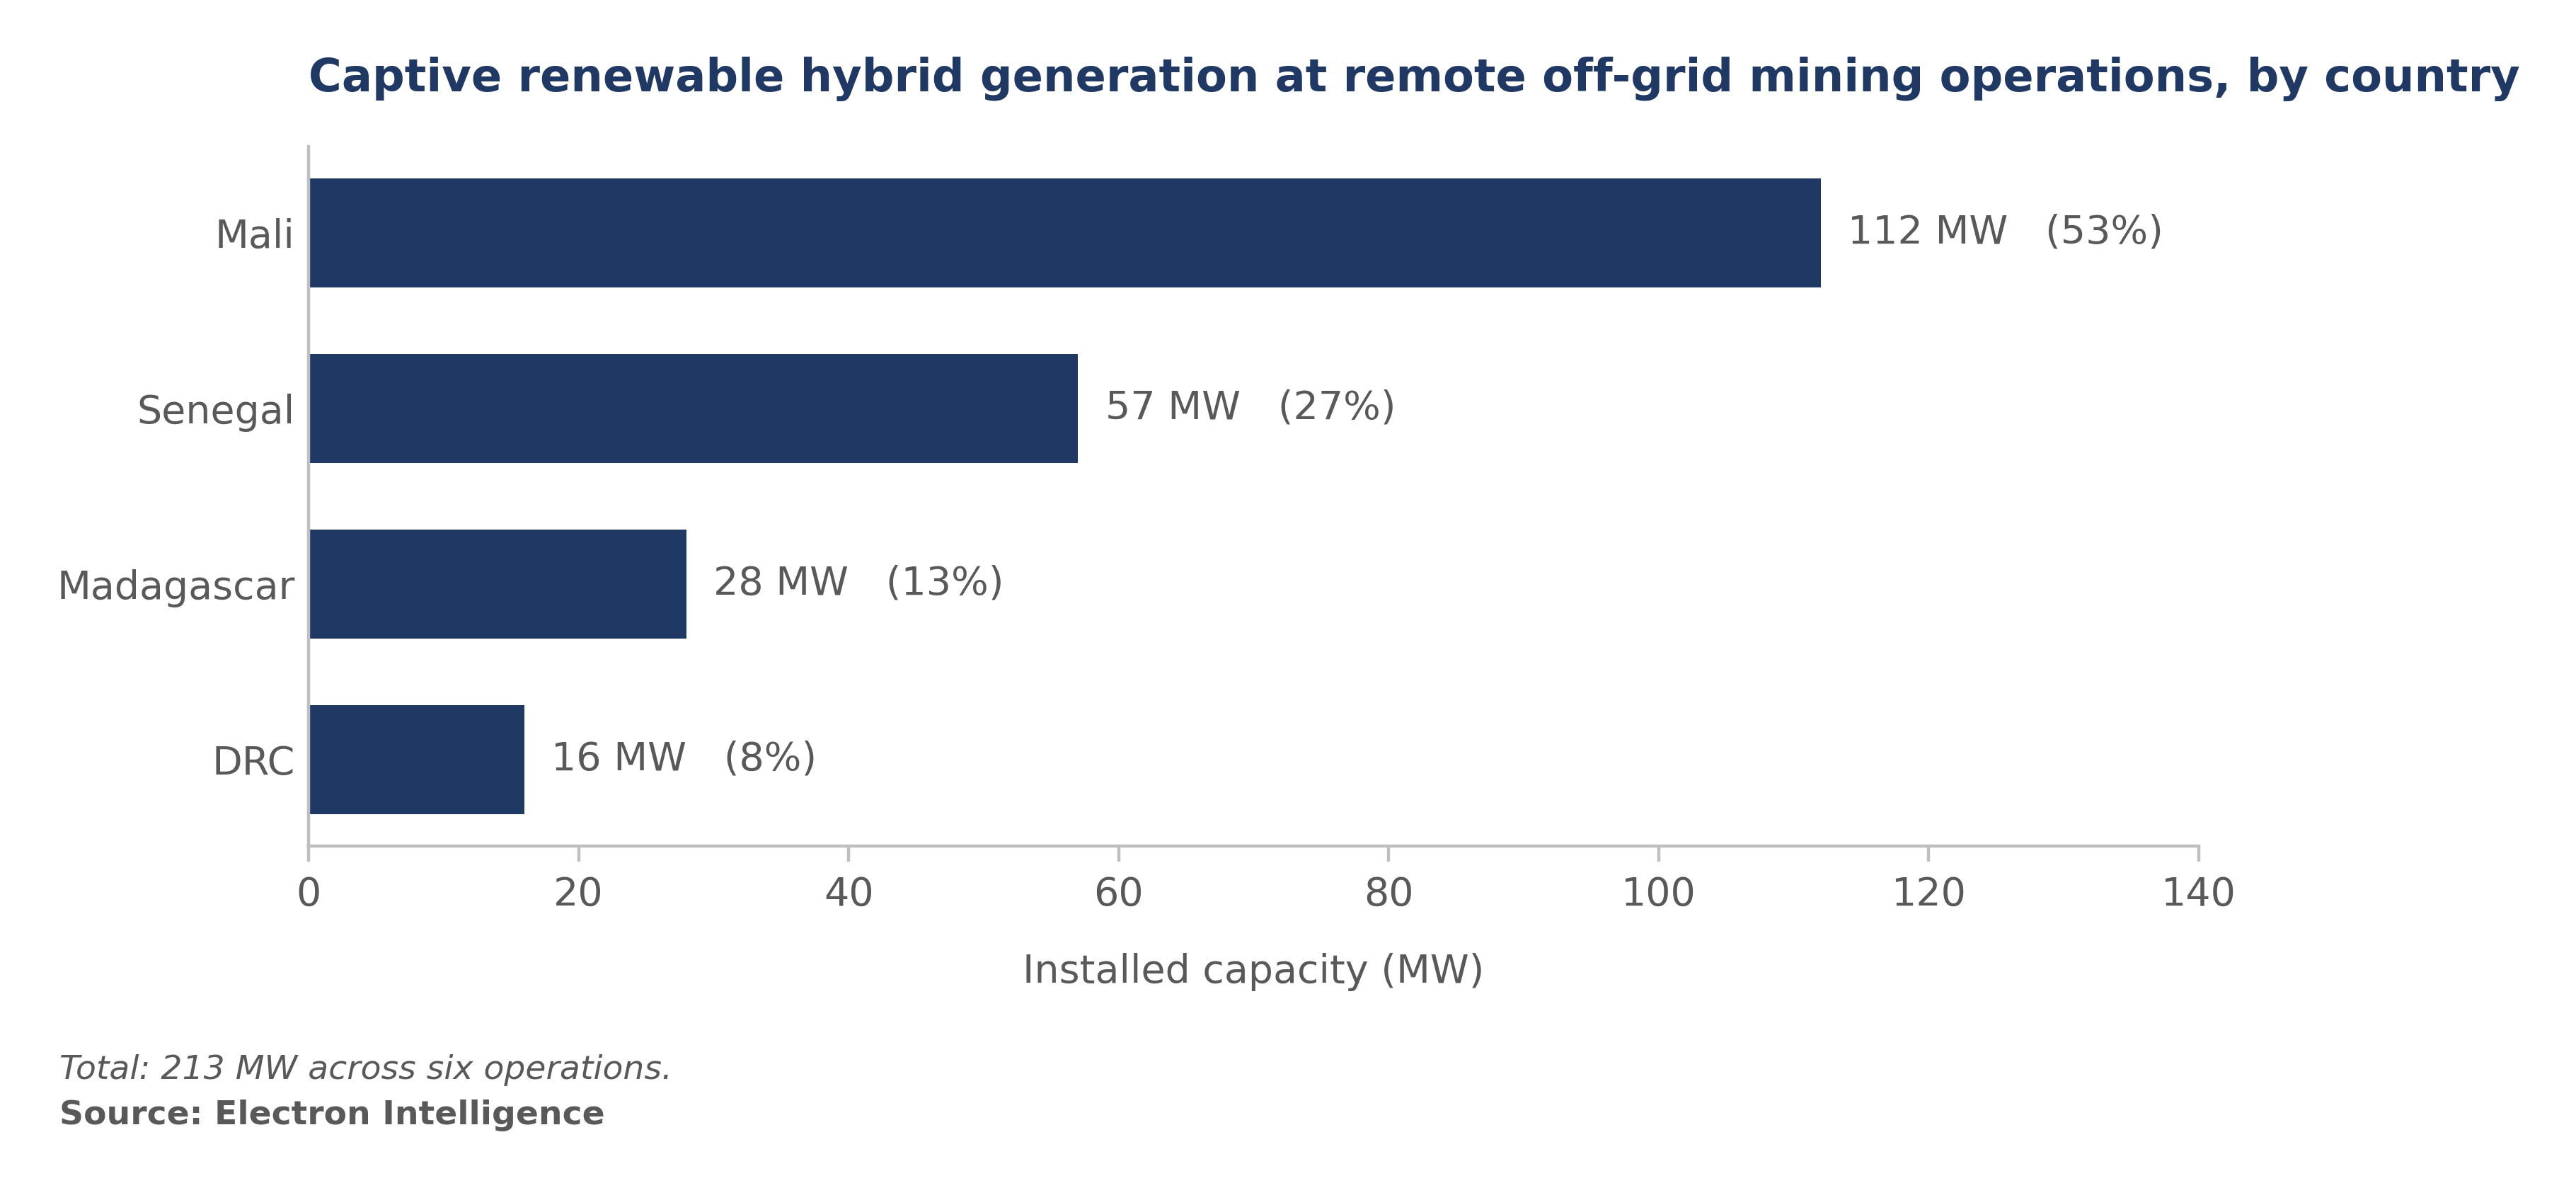
Figure 1: Captive renewable hybrid generation by country of operation. Mali accounts for 132 megawatts (62 per cent) across three operations; the West African concentration reflects where listed-company gold mining sits relative to the continent’s grid infrastructure. Source: Electron Intelligence.
Six Disclosed Operations, What the Concentration Reveals
Five of the six projects are gold mines: four in West Africa, one in the DRC. The sixth is Rio Tinto’s QMM titanium operation on Madagascar’s southeastern coast. The dataset covers listed-company operators with formal disclosure obligations. Energy for Growth Hub’s May 2026 scan of African mining-related power projects identified the absence of a public sector inventory as a sector-wide gap in disclosure; the EI registry is the floor inventory for the listed-company renewable hybrid captive subset.
Barrick’s Loulo-Gounkoto in western Mali is the largest project at 60 megawatts and has been off-grid since first production. Mali’s military transition in 2021 and subsequent ECOWAS sanctions added country risk that the cost arithmetic does not address: the power investment predated the political transition; the operating environment it now runs in does not. B2Gold’s Fekola, also in Mali, was expanded in two phases to 52 megawatts, with Phase 2 commissioning in March 2025. Phase 1 delivered heavy fuel oil savings of 13.1 million litres per year; B2Gold records actual energy cost savings of approximately USD 9 million in 2023, equivalent to roughly USD 16 per ounce. Resolute’s Syama (20 megawatts, Mali, 2018) and Endeavor’s Sabodala-Massawa (37 megawatts, Senegal, 2023) complete the West African picture. Syama, in southern Mali, also operates under a build-own-operate structure — an Aggreko 16-year design-build-operate-maintain contract, commissioned in 2018 and the earlier of the two BOO arrangements in this dataset; Resolute’s on-balance-sheet capex was limited to approximately USD 5 million of thermal preliminary works. Sabodala-Massawa sits in the eastern Senegal gold belt and is balance-sheet financed in the conventional pattern.
The Kibali operation in northeastern DRC runs primarily on run-of-river hydro; the 16-megawatt solar installation supplements supply during low-flow periods. QMM is the dataset’s most capital-intensive project per megawatt and the only one financed through external project capital: 14 megawatts-peak of solar, 16 megawatts of wind across 19 turbines (Madagascar’s first commercial wind farm), 16 megawatt-hours of battery storage, and 21 megawatts of thermal back-up. CrossBoundary Energy reports the integrated system will supply approximately 56 per cent of QMM’s total energy demand once fully operational. Like every other site in this dataset, QMM operates because there is no grid. How it is financed is what makes it the dataset’s most consequential project, and the subject of the next section.
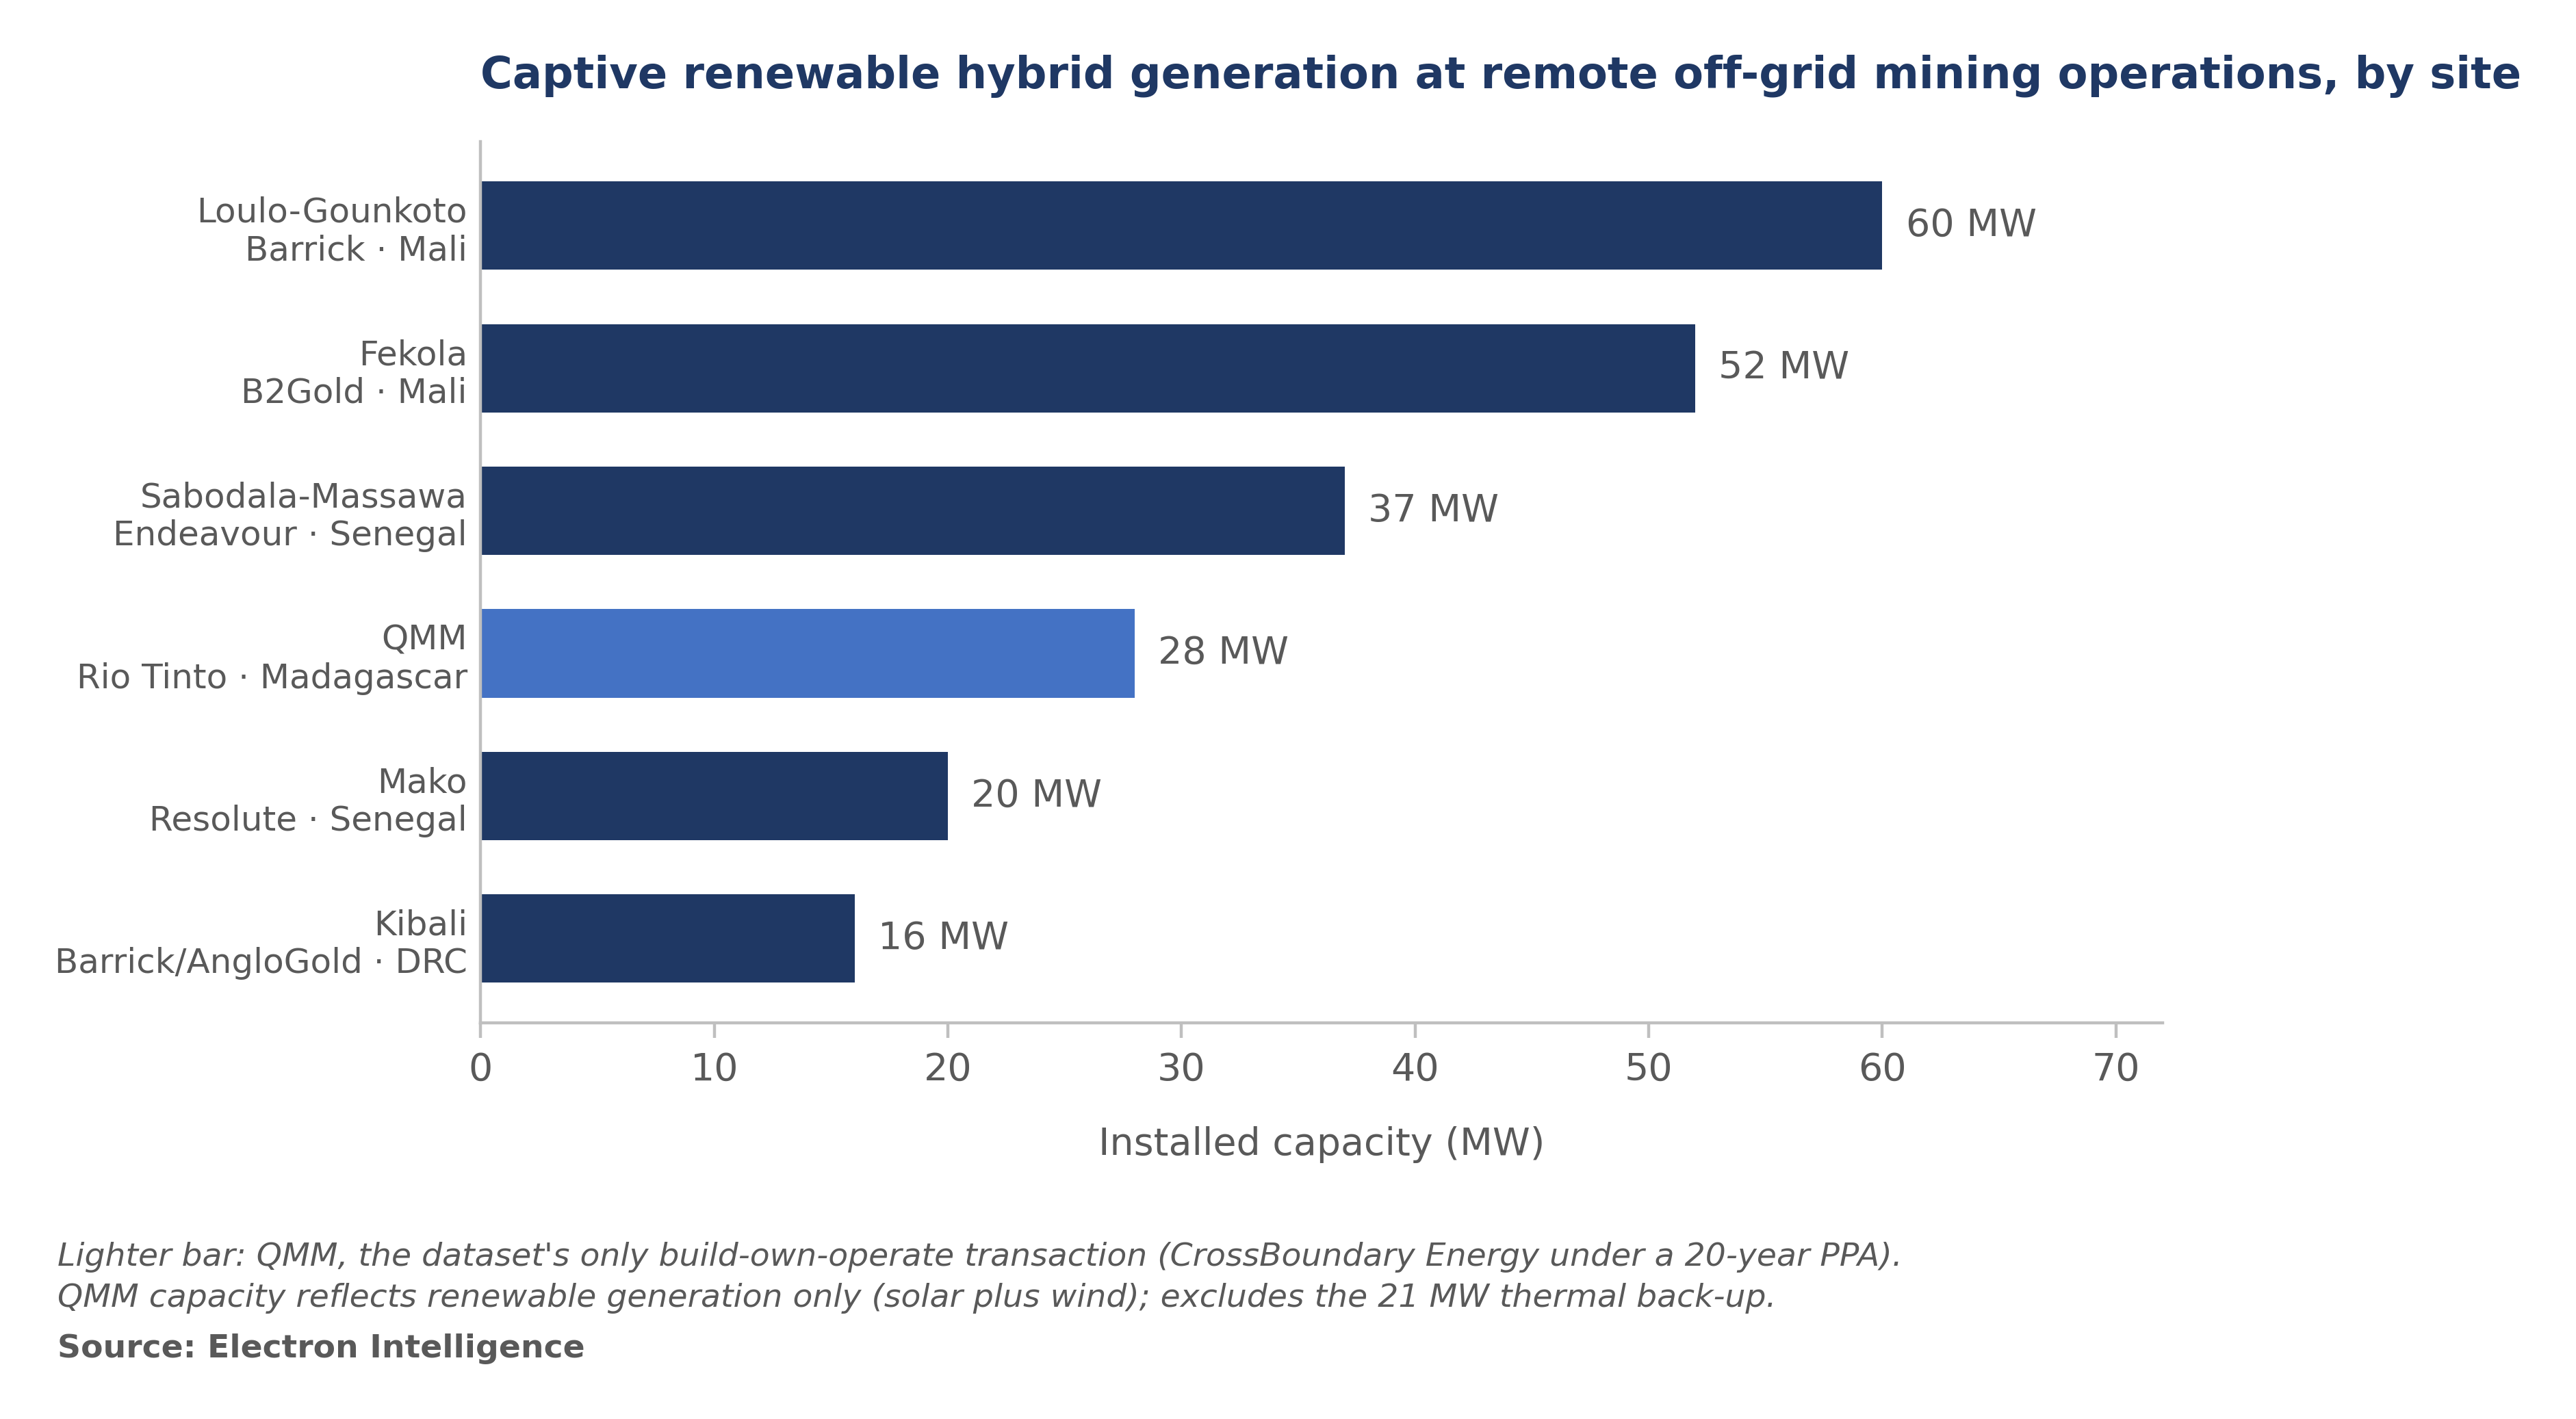
Figure 2: Installed capacity by operation, megawatts. Loulo-Gounkoto is the largest project at 60 megawatts; West African gold mines account for 169 megawatts, 79 per cent of the disclosed total. Lighter bars (Syama and QMM) denote the two build-own-operate structures. QMM shown at 28 MW (AIOT AC output capacity); renewable generation components are 14 MWp solar (DC-rated) and 16 MW wind; the DC-to-AC conversion accounts for the difference from the sum of rated components. Excludes 21 MW thermal backup. Source: Electron Intelligence.
How the Six Were Financed
The six projects have been financed across two broad categories — balance-sheet builds and build-own-operate structures — with the two BOO transactions carrying meaningfully different capital structures. The distinction determines where external capital can enter and on what terms.
Four were funded directly by the mining companies. Capital was allocated from the corporate balance sheet, with the generation asset belonging to the mine’s operating infrastructure rather than to a standalone financed project. There is no ring-fenced revenue stream, no special-purpose vehicle, and no separate security package for a lender to underwrite against. At sector-benchmark capital costs of USD 1.2 to 1.5 million per megawatt for solar-plus-storage hybrid systems, the balance-sheet-financed 165 megawatts in this dataset represents approximately USD 200 to 250 million of capital absorbed onto mining balance sheets, before ongoing operations and maintenance.
The two build-own-operate transactions are structured differently and carry different capital implications. At Syama, Aggreko holds the generation asset under a 16-year design-build-operate-maintain contract; Resolute pays for power delivery and has no material generation capex on its balance sheet. The structure is a utility services contract: Aggreko’s risk is primarily operational, and the capital is Aggreko’s own. At QMM, CrossBoundary Energy owns the generation asset against a 20-year power purchase agreement with Rio Tinto, and finances it through a platform-level capital stack assembled at the holding-company level. That stack has three components: a USD 495 million Multilateral Investment Guarantee Agency (MIGA) framework providing portfolio-based political-risk cover across up to 20 African countries and approximately 100 projects, including blended-finance first-loss layers of USD 61.5 million from the International Development Association Private Sector Window and USD 37.6 million from the Renewable Energy Catalyst Trust Fund; and a Standard Bank of South Africa mandate to lead and arrange up to USD 300 million of senior debt to scale CrossBoundary’s commercial and industrial renewables portfolio.
The QMM agreement is bankable in its own right. Rio Tinto is investment-grade across all three major rating agencies, the mine has produced since 2009, and reserve life is publicly disclosed and audited. Captive power demand at a producing mine is non-discretionary, which makes the contracted offtake durable from the financier’s side. From the miner’s side, the affordability of a 20-year commitment rests on the diesel cost it displaces. Allied Gold’s October 2025 disclosures on the Sadiola operation in Mali reported a 45 per cent energy cost reduction following captive renewable commissioning, implying a pre-transition energy cost of USD 150 to 200 per ounce, or 20 to 30 per cent of all-in sustaining cost at prevailing gold prices.
Figure 3: African remote-mine captive renewable hybrid generation projects.
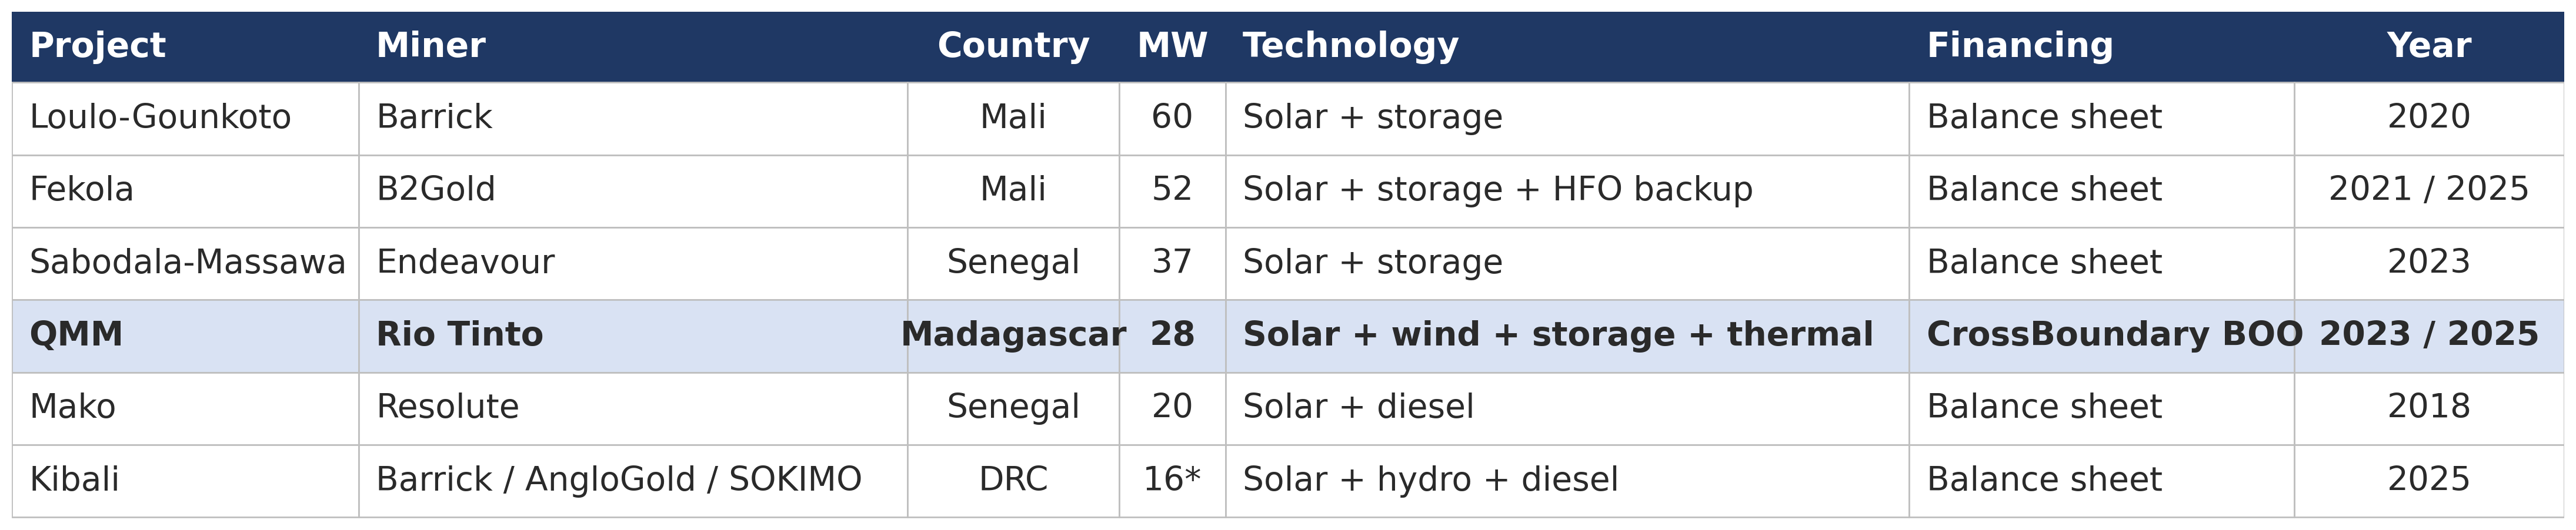
Five of six are gold mines; four of six are balance-sheet financed. Syama (Aggreko 16-year DBOM) and QMM (CrossBoundary BOO) are the two off-balance-sheet structures. * Kibali: 16-megawatt solar supplements primary run-of-river hydro. QMM MW reflects AIOT-tracked disclosed capacity; full system includes 16 MWh battery storage and 21 megawatts thermal back-up. DQI-A for all projects except Sabodala-Massawa (DQI-B). Source: Electron Intelligence AIOT.
Why Balance-Sheet Financing Will Throttle the Next Wave
The disclosed 213 megawatts is the floor of what the EI registry tracks for the remote off-grid category. Beyond it sit 1,946 megawatts of additional captive renewable capacity in the grid-connected and end-market categories, much of it in advanced planning or pre-final-investment-decision stages. If the financing pattern that produced the existing 213 megawatts continues at roughly the same balance-sheet proportion, the next several years of mining capital allocation will absorb investment at a level the listed-company miners involved cannot fund alongside reserve replacement, exploration, and acquisitive growth. The arithmetic breaks down before the pipeline is built out. Applying the same 77 per cent balance-sheet proportion to the 1,946 megawatts in the remainder of the EI pipeline implies approximately USD 1.8 to 2.3 billion of additional capital drawn from listed-company mining balance sheets — before reserve replacement, exploration, or acquisitive growth.
Offtake supply, not capital supply, is the constraint on scaling. CrossBoundary’s platform stack is sized for approximately 100 projects across up to 20 countries, not for QMM alone, and combines political-risk cover at the holding-company level, an arranged senior debt facility, and blended-finance first-loss layers. How many other remote mining operations meet the Rio-equivalent underwriting threshold determines how much of that capacity gets deployed. Whether a second developer assembles a comparable stack determines whether CrossBoundary remains the only route.
CrossBoundary remains the only operator running this structure at scale. Aggreko’s Syama demonstrates that a project-level build-own-operate contract is executable against a junior or mid-tier mining counterparty, but it is a utility services arrangement, not a project finance transaction. Replicating the CrossBoundary model requires an investment-grade or near-investment-grade offtaker, multi-decade reserve life, audited disclosure, and a jurisdiction where political risk insurance can be priced. Several listed-company African miners meet that bar. Barrick at Kibali and AngloGold’s broader African portfolio are the strongest near-term candidates (EI analysis, DQI-C). No second developer has announced a comparable platform as of this writing.
What We’re Watching
- The next non-Rio build-own-operate transaction, and a second developer’s platform. CrossBoundary’s structure works because Rio Tinto is investment-grade and QMM has produced since 2009. The replicability test has two halves: a second build-own-operate transaction announced against a different mining counterparty, and a second developer assembling a comparable platform-level capital stack at scale. Neither has been disclosed as of this writing.
- Mali risk repricing. Three of the six operations sit in Mali: Loulo-Gounkoto, Fekola, and Syama, totalling 132 megawatts, 62 per cent of the disclosed dataset. All three sit in a country under military governance since 2021. The existing power assets are operational, but the country risk surrounding them moves with each political cycle. How that risk is priced in any future refinancing or developer-model transaction will determine whether the build-own-operate model can extend into the higher-country-risk corridors where the largest remote-mine builds are concentrated.
Bottom Line
The cost case for switching captive power at Africa’s remote mines from diesel to solar-plus-storage hybrid no longer divides opinion. The disclosed build is 213 megawatts across six operations. Four were financed from mining-company balance sheets; two were structured as build-own-operate transactions with meaningfully different capital models. The disclosed pipeline will continue to grow and the cost spread to widen.
The transition will continue. This dataset reveals the capital structure that will fund the next wave. CrossBoundary Energy’s platform stack at QMM is the only platform-level, project-finance-structured example of off-balance-sheet capital assembled at scale for African mining captive renewables. Whether enough Rio-equivalent counterparties produce bankable offtake to absorb that capacity, and whether a second developer assembles a comparable platform, will determine the pace of the build through this decade. Parts 2 and 3 apply the same analytical frame to grid-connected and end-market-driven builds, each with a different financing architecture.