The Factors Pushing African Miners to Buy Clean Energy, Why SA is Dominant
South African miners are moving $2.1bn of power-supply capital off their own books and onto developers, cutting energy costs 60% in the same transaction.
South Africa's mines run on Eskom power, and Eskom's grid is among the dirtiest on earth, nearly five times as carbon-heavy as Europe's. For decades, that was simply an operating cost. Since January 2026, when the EU's new carbon-border tariff began charging importers for that carbon at the European border, it has become something else: a cost attached to every tonne shipped to Europe. This report examines how miners are responding and why the tool they have chosen, the wheeled renewable power purchase agreement, is quietly changing who pays for mine power in Africa.
Taxonomy: How to read this
On-site (behind-the-meter): a plant the mine builds on its own site and funds itself.
Scope 2 emissions: the carbon in the electricity a mine buys, as distinct from what it burns directly.
Carbon-border tariff (CBAM): the EU’s charge on the carbon embedded in goods entering Europe.
Corporate power purchase agreement (CPPA): a long-term contract under which a mine buys that power from an independent developer, who owns and funds the plant.
Wheeling: generating clean power at one site and delivering it to a mine across Eskom’s existing grid for a network fee.
Executive Summary
- The analysis covers fifteen projects in South Africa and Zimbabwe carrying 1,582 megawatts, plus two AngloGold Ashanti sites in Ghana not yet sized. Of that capacity, 1,526 megawatts is bankable, meaning operational, under construction, or past a final go-ahead. The remaining fifty-six megawatts is still at the proposal stage and is excluded.
- South Africa accounts for 98% of the capacity. It is the only African market that combines a high-carbon grid, a working system for moving power across the grid to a buyer, and listed miners answerable to European and UK lenders. That concentration is itself a finding.
- The projects are split into two groups. The first, 758 megawatts, is regulation-driven: platinum-group-metal and chrome operations whose exports face the EU carbon tariff. The second, 824 megawatts, is voluntary: gold, coal, and titanium operations acting on lender pressure and the economics of Eskom’s rising tariff.
- A wheeled clean-power contract delivers electricity at about R0.73/kWh, roughly 60% below Eskom’s direct industrial tariff of R1.85. In one move, it cuts the energy bill and lowers the carbon charge, provided the mine can prove its power is renewable.
- Of an estimated $2.5bn in total capital, $2.14bn (85%) sits off the miners’ books, carried by developers and their lenders.
- Eskom’s July 2025 court challenge to five power-trading licenses was suspended in February 2026 pending new trading rules. Two of the contested traders, Discovery Green and NOA, supply projects here; capacity wheeled through Etana is unaffected.
Three forces out of Europe are pushing miners to buy clean power
The trigger for this investment wave is regulation, and it starts in Europe. The European Union’s Carbon Border Adjustment Mechanism (CBAM) is the prime regulation driving this change. Since January 2026, the EU’s carbon-border tariff has charged importers for the carbon embedded in what they buy, including the grid power used to make it.¹ South Africa’s grid is rated at about 940 grams of CO2 per unit of electricity, near the top of the global table. At that level, a platinum-group-metal producer drawing 50 megawatts from Eskom and shipping auto-catalyst to Europe carries a measurable carbon charge on every ton it sells.
Proving the power came from renewable sources cuts the embedded carbon and the charge with it. The yardstick is Europe’s own grid, headed for roughly 100 grams under its 2030 climate plan. Eskom’s 940 is more than nine times higher. That gap is the investment case.
The EU Critical Raw Materials Act (CRMA) applies parallel pressure through the financing channel. The EU’s critical-raw-materials law lets strategic minerals, platinum-group metals, cobalt, lithium, and nickel, among them, qualify for preferential treatment, but only if producers meet environmental and governance standards. ² European development banks and lenders backing these projects have started treating a renewable-power commitment as a condition of the money.
The biggest miners have already written this into their debt. Gold Fields, Sibanye-Stillwater, and Exxaro have each tied the cost of multi-billion-rand loans to hitting emissions targets.³ Cutting grid power is no longer optional for them; it is a loan condition.
On these lines, the dataset splits in two. Seven projects, 758 megawatts, have platinum-group-metal or chrome output exposed to the European carbon tariff; this is the regulation-driven group. The remaining 824 megawatts, gold, coal, and titanium, sit outside the tariff’s reach, so lender pressure and Eskom’s tariff economics drive those decisions instead. The two groups behave differently and are treated separately throughout.
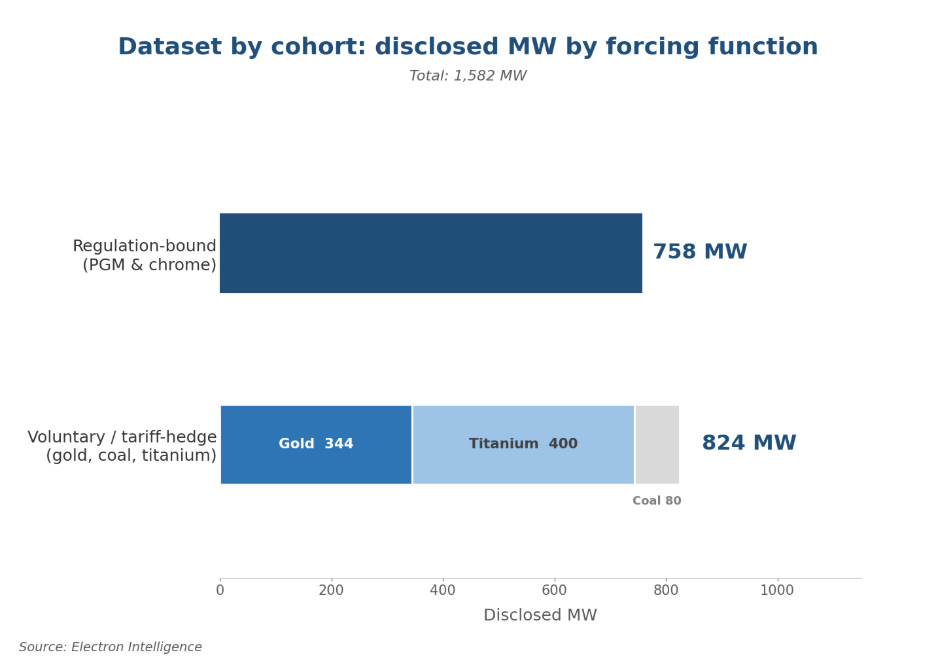
Figure 1: Capacity by driver. The regulation-driven group (758 MW) faces a direct EU carbon charge; the voluntary group (824 MW) responds to lender pressure and Eskom's tariff.
Why this is a South African story: three things no other African market has at once
South Africa holds 98% of the 1,582 megawatts here. The concentration reflects where the conditions for this kind of deal line up.
Three things have to be true at once. First, a high-carbon grid: at about 940 grams of CO₂ per unit, Eskom both maximizes the European carbon charge and makes clean power worth the most as an alternative. ⁴
Second, a working way to move power across the grid: Eskom’s wheeling tariff lets an independent producer generate power at a remote site and deliver it to a mine, which is what makes these off-balance-sheet contracts possible at scale. Third, listed miners are answerable to European and UK shareholders and lenders, who pass financing conditions straight through to spending decisions. No other African market offers all three today.
Grid reliability is a second prize the tariff comparison misses. South Africa had power cuts on more than 200 days in 2023. On-site renewable plants, especially those paired with batteries, keep a mine running through outages, a benefit that holds regardless of the carbon math.
Of the bankable 1,526 megawatts, 228 are already running today: Gold Fields’ South Deep (50 MW), Harmony Phase 1 (30 MW), the Castle wind farm (89 MW), and Pan African Resources’ operating portfolio (59 MW).
The cheaper power: 60% below Eskom, and it lowers the carbon charge too
The delivered price has two parts. The clean power itself costs about R0.48/kWh, the going rate from South Africa’s renewable-energy auctions. Moving it across Eskom’s grid, the wheeling charge, adds about R0.25. Delivered cost: roughly R0.73/kWh ($0.045).⁵ One caveat on the wheeling charge: it assumes a deep underground mine drawing near-constant power. Open-pit mines run lighter, which lifts their per-unit wheeling cost by 20 to 40%.
Eskom’s own industrial tariff comes to about R1.85/kWh ($0.114), a blended figure across peak and off-peak rates that still needs a final rebuild from the published schedules. ⁶ A mine’s exact number varies with its shift pattern. On that basis, the discount is about 60%.
Put in production terms, a deep underground mine using 150,000 MWh a year would cut its power bill by roughly $10M annually by switching from Eskom to a wheeled contract, a real dent in all-in sustaining cost.
To claim the carbon benefit, the mine has to prove the power is genuinely renewable; a paper certificate alone will not do.⁷ A wheeled contract, routed through a licensed trader that links a specific plant to the mine’s meter, provides that audit trail. In effect, it lifts the mine out of the carbon baked into Eskom’s tariff.
One constraint shifted character in early 2026. Eskom’s July 2025 challenge to five power-trading licenses was suspended on 27 February 2026 pending new trading rules; wheeling continues in the meantime. Two contested traders appear here: Discovery Green (Implats Springs, 30 MW) and NOA Group (Pan African’s 40 MW, plus NOA’s share of Tronox and Northam). Capacity wheeled through Etana, Harmony Phase 1, Sibanye-Stillwater, and Tharisalicense is unaffected, since Etana’s license is not under challenge. This is a regulatory-process risk, not an imminent ruling.
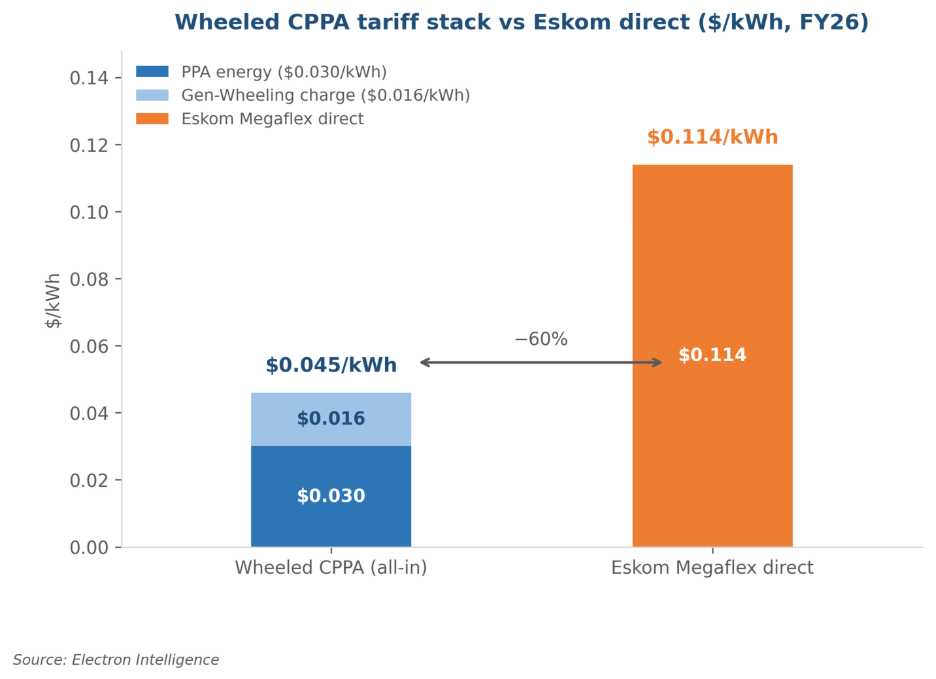
Figure 2: What the delivered price is made of, versus Eskom direct (FY26, $/kWh). Clean power ($0.030) plus the grid wheeling charge ($0.016) delivers $0.045/kWh, about 60% below Eskom direct at $0.114.
From the mine’s balance sheet to project finance: how $2.1bn changed hands
Part 1 of this series covered remote off-grid mines that built their own power at $1.2-1.5M per megawatt on their own balance sheets. ⁸ The mine owned the asset and carried the cost, which limited the model to operations with spare cash.
Part 2 works differently. Under a wheeled contract, the developer owns and funds the plant against a 15-to-20-year purchase commitment, so the mine’s upfront capital outlay is close to zero. One caveat: under lease-accounting rules, a long contract for dedicated capacity can still place a matching asset and liability on the mine’s books.⁹ The off-balance-sheet point here refers to capital spending only.
Of an estimated $2.5bn in total Part 2 capital, $2.14bn (85%) sits off the miners’ books, carried by developers and their lenders. The $365M that stays on the books is split between four self-built on-site projects: Gold Fields South Deep, Exxaro Grootegeluk, Implats Zimplats, and Pan African’s Evander expansion, and the self-build halves of three hybrid projects. The figures are directionally robust; nine of the projects use developer-disclosed proxies where operators have not published their own capital costs.
The mix explains the outcome: four projects (177 MW) are self-built on site, seven (1,089 MW) are pure wheeled contracts, three (260 MW) are hybrids, and one (56 MW) is a contract not yet wheeled. The dominance of wheeled contracts is what moves the capital off the mine’s balance sheet.
The two structures are not strictly comparable. On-site solar runs only in daylight and typically covers 15-25% of a mine’s round-the-clock load, while wheeled wind-and-solar contracts, balanced by Eskom, cover much more. So the off-balance-sheet benefit of a wheeled contract should not be read as a like-for-like saving per megawatt against a self-build. Where Part 1’s model limited building to cash-rich mines, Part 2 hands the capital problem to the developer and funds it through project finance.
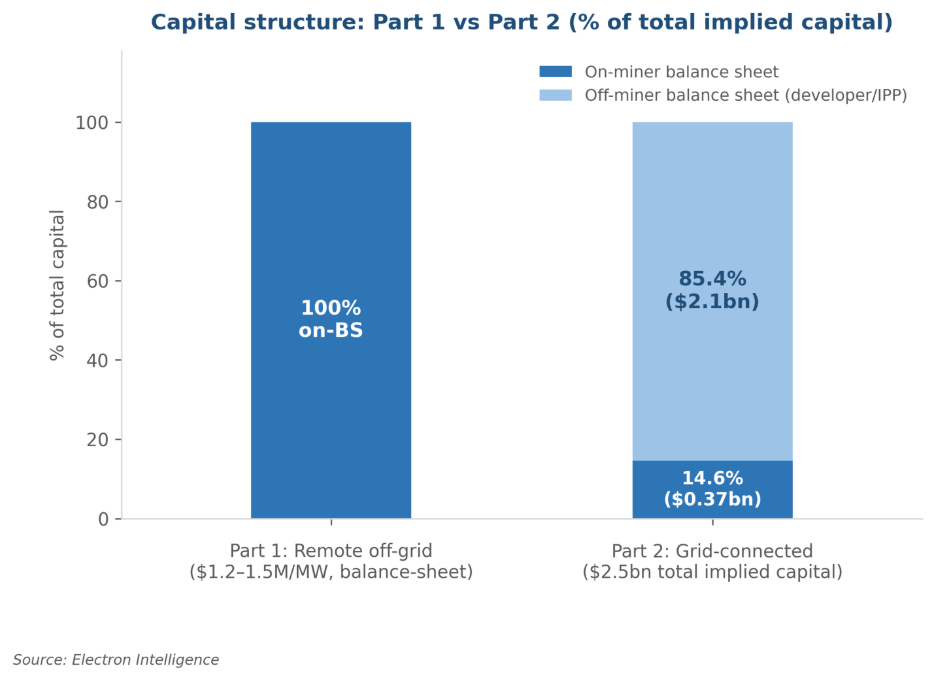
Figure 3: Who carries the capital, Part 1 versus Part 2. Part 1's off-grid builds sat entirely on the mine's balance sheet at $1.2-1.5M/MW; Part 2's $2.5bn is 85% off it.
Two risks the model can’t price: a shrinking discount and an unsettled rulebook
The main structural risk is that Eskom’s own tariff stops rising, or falls, as new generation comes online, narrowing the discount. The wheeling charge itself is reset at Eskom’s multi-year price reviews, and a 15-to-20-year contract spans three or four of them. Even a 20% rise in the wheeling charge only lifts the delivered price to about R0.78/kWh, still a 57% discount.
The economics absorb a higher wheeling charge comfortably. They are more exposed to a sustained fall in Eskom’s direct tariff. A mine locked into a 20-year contract at R0.73 looks very different if Eskom’s price drifts down toward that level. The same structure that shifts capital risk to the developer also takes pricing flexibility away from the mine.
For the voluntary group, where the price saving is the whole rationale, this is the main long-run risk. For the regulation-driven group, the carbon argument holds regardless of where the tariff spread lands.
The nearer-term risk is the trading-licence dispute, now suspended pending South Africa’s new trading rules rather than awaiting a verdict. The exposed capacity runs through the contested traders, Discovery Green and NOA, not the Etana-wheeled projects. A further question the dataset can’t answer is counterparty risk over a 20-year contract: no one has stress-tested whether these developers stay solvent across the full life, and the rules overhaul is an early sign of that uncertainty.
What remains untested is whether the same pressure shows up at the customer’s border rather than the mine’s grid. As the Mozal case below shows, carbon exposure and the decision to invest are not the same thing once the economics of power supply break down.
Bottom Line
Grid-connected mines are buying clean power for two reasons: staying on Eskom has grown expensive, and their lenders have made cutting grid emissions a condition of capital. Europe’s carbon border now puts a price on the rest. A wheeled contract at R0.73/kWh answers both at once: it cuts delivered power cost by 60% against Eskom and lowers the carbon charge on every tonne of platinum-group metal or chrome shipped to Europe.
The financing has shifted to match. Where Part 1’s mines built and owned their power at $1.2-1.5M/MW, Part 2 shows $2.14bn carried by developers and their lenders, directionally robust but resting on proxies for the nine projects without published costs. The mine’s power-cost problem has moved onto the developer’s balance sheet. That transfer is the real story of this dataset.
What We’re Watching
The pressure documented here, a carbon price on Eskom-grid power, applies to mines that produce and sell. The next question is whether it travels one step upstream, into the battery supply chain. Carmakers and battery-cell makers buying South African platinum-group metals and lithium face their own renewable-sourcing demands from regulators and customers. If those demands turn into explicit clauses in supply contracts, they would create pressure at the mine gate that works independently of the local grid. That has not yet happened at scale.
Mozal Aluminium, a smelter in Mozambique exposed to the EU carbon tariff, entered care and maintenance on 15 March 2026 after failing to secure affordable power beyond that date. Its shutdown, driven by power-supply economics rather than the carbon tariff itself, shows that regulatory exposure and the investment decision are not the same thing. Whether the EU carbon tariff, US critical-mineral sourcing rules, or battery-maker supply clauses have actually triggered a final go-ahead at the mine level, rather than merely shaped one, is the next line of inquiry.
Notes & sources
¹ EU carbon-border tariff (CBAM): Commission Implementing Regulation (EU) 2025/2621, Annex III (electricity default values), applicable 1 January 2026. South Africa’s grid factor of about 940 gCO₂/kWh: DFFE 2023 Grid Emission Factors Report (G.N. 6454).
² EU Critical Raw Materials Act (Regulation (EU) 2024/1252): Strategic Project designation covers 34 listed raw materials and requires ESG compliance under Article 6.
³ Sustainability-linked facilities: Gold Fields, $1.2bn syndicated facility (2022); Sibanye-Stillwater, $1bn sustainability-linked loan (2021); Exxaro, $93M/ZAR1.5bn sustainability-linked bond, JSE (2022). Each embeds Scope 2 reduction targets.
⁴ Eskom grid carbon intensity, about 940 gCO₂/kWh: DFFE 2023 Grid Emission Factors Report (G.N. 6454).
⁵ Wheeled tariff build-up: clean-power energy R0.48/kWh (REIPPPP Bid Windows 5-6 weighted average, about 2,620 MW cleared 2022-2024; IPP Office/NERSA). Wheeling R0.25/kWh from Eskom Megaflex Gen-Wheeling FY26 line items: Transmission Use of System R35.60/kVA/month, Distribution Use of System R21.50/kVA/month, plus losses (about 8.5%), legacy, ancillary, and service charges at an 85% high-voltage mining load factor (Eskom Schedule of Standard Prices 2025/26, NERSA-approved 11 March 2025).
⁶ Eskom Megaflex direct, about R1.85/kWh: modeled time-of-use blend, pending a line-item rebuild from the FY26/FY27 schedules.
⁷ CBAM attribution: under the implementing regulation, a producer must show a power purchase agreement meeting additionality and time-matching criteria; an unbundled renewable energy certificate alone does not qualify.
⁸ Electron Intelligence Mining Captive Energy Model (May 2026).
⁹ Lease accounting: long contracts for dedicated capacity may require assessment under IFRS 16, potentially recognizing a right-of-use asset and a corresponding lease liability.