What Drove Financial Performance Across Africa's Utility-Scale Operators
Africa's power sector continues to attract significant investment as countries expand electricity generation and transmission infrastructure to meet growing demand. At the same time, utilities face increasing pressure to improve financial performance and generate sustainable returns from these investments. Yet companies operating in similar markets often deliver very different financial outcomes, raising important questions about what drives financial performance across the sector.
This analysis compares the operating and financial performance of 26 listed power companies across Africa to examine which factors best explain those differences. Rather than focusing solely on infrastructure expansion, it considers revenue productivity, business model, ownership, cash generation and capital structure to identify the characteristics associated with stronger financial outcomes.
Executive Summary
- Building more infrastructure did not always result in stronger financial performance: Companies that rapidly expanded generation capacity or transmission networks did not necessarily outperform those operating relatively stable asset bases.
- Business model had a greater influence on financial outcomes than ownership alone: Stand-alone transmission businesses and generators generally recorded stronger operating performance than vertically integrated utilities, reflecting differences in capital recovery and operating structure rather than ownership.
- Government ownership did not automatically result in weaker operating performance: State-linked companies generally matched or outperformed private-linked peers in revenue growth, EBITDA margins and operating cash generation. The principal differences were higher leverage, weaker liquidity and lower asset productivity.
- Strong local-currency revenue growth did not always translate into stronger US dollar performance: Several companies reported rapid nominal revenue growth while recording much weaker growth, or declines, in US dollar revenue, highlighting the importance of preserving hard-currency earnings.
Infrastructure Expansion Alone Did Not Consistently Deliver Stronger Financial Performance
Infrastructure expansion, private ownership and market liberalisation are often associated with stronger financial performance across Africa's power sector. The companies analysed did not consistently follow that pattern. Some of the strongest operating results came from state-linked companies, while several companies undertaking large infrastructure programmes generated weaker financial outcomes than peers operating largely unchanged asset bases.
Several companies substantially increased generation capacity and transmission networks during the period, yet revenue productivity and cash generation did not improve at the same pace as their operating asset base. In contrast, companies operating largely unchanged infrastructure often generated stronger financial outcomes despite making relatively limited additions to capacity.
Ownership produced a similarly mixed picture. State-linked companies generally matched or exceeded private-linked peers in US dollar revenue growth, EBITDA margins and operating cash generation, yet carried higher leverage, weaker liquidity and lower asset turnover. Ownership influenced financial structure, but it did not consistently distinguish stronger operating performers from weaker ones.
Revenue Productivity Distinguished Stronger Performers More Clearly Than Asset Growth
Companies expanding infrastructure encountered very different commercial and operational conditions once those assets entered service. Those conditions determined how quickly new generation plants and transmission networks converted additional capacity into revenue and cash flow, creating very different financial outcomes despite similar levels of investment.
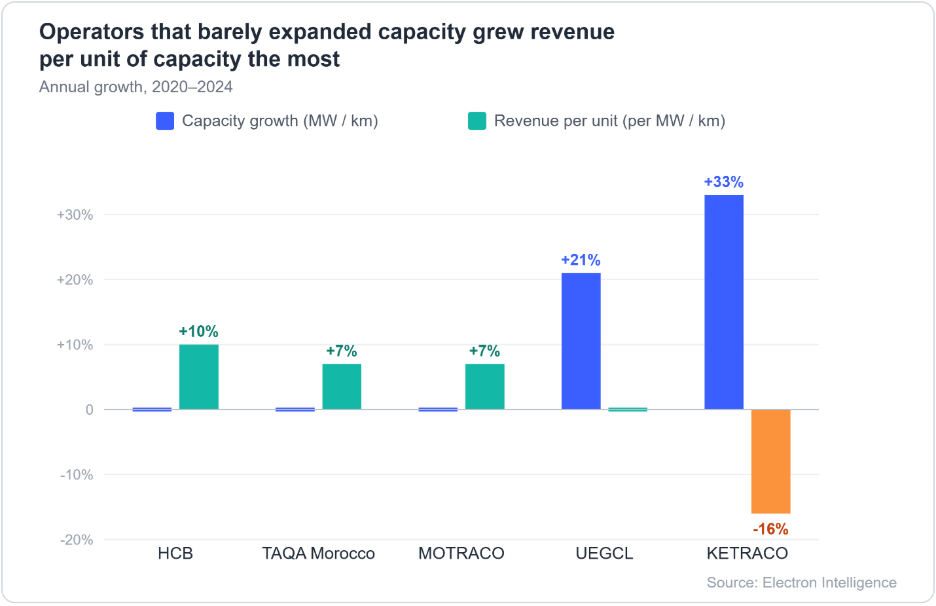
Fig 1: Revenue productivity, measured as revenue per megawatt of installed capacity for generation companies or per kilometre of network for transmission companies, rose fastest for companies with stable asset bases (HCB, TAQA Morocco, MOTRACO); UEGCL and KETRACO expanded their asset base far more but did not see comparable productivity gains. Asset figures reflect installed MW (gencos) or network km (gridcos), not balance sheet assets.
Several companies illustrate different parts of this process. UEGCL substantially expanded installed generation capacity through the Isimba and Karuma hydropower projects, but electricity continued to be billed primarily on the basis of energy dispatched rather than installed capacity. Lower-than-planned dispatch, together with rising depreciation, interest expense and foreign exchange losses, slowed the financial return from those investments. KETRACO encountered a different challenge. As the transmission network expanded, wayleave disputes, contractor insolvencies and project delays extended the time required to bring new infrastructure into commercial operation. Delayed customer payments also increased expected credit losses, while contractor claims and arbitration costs added further financial pressure.
Companies operating mature infrastructure faced a different set of economics. TAQA Morocco increased financial performance without materially expanding generation capacity by maintaining high plant availability, improving operational efficiency and operating under long-term power purchase agreements that provided stable capacity payments. HCB and MOTRACO followed a similar financial pattern. Although their operating asset bases changed relatively little during the period analysed, both companies continued to generate stronger commercial returns from infrastructure already in operation. Their financial performance suggests that once infrastructure reaches a mature operating phase, improving utilisation, contractual stability and operational performance can become more important drivers of earnings than continued physical expansion.
The contrast highlights an important distinction across the sector. Expanding infrastructure increased the size of the operating asset base, while commercial performance depended on how quickly those assets generated predictable revenue, recovered invested capital and supported sustainable cash flow.
How Companies Earned Revenue Shaped Financial Performance
The companies analysed operated different electricity businesses. Some generated electricity, others transmitted it, while integrated utilities combined generation, transmission and distribution within a single business. These commercial models exposed companies to different revenue drivers, regulatory frameworks and capital requirements, making direct comparisons based solely on infrastructure size or ownership incomplete.
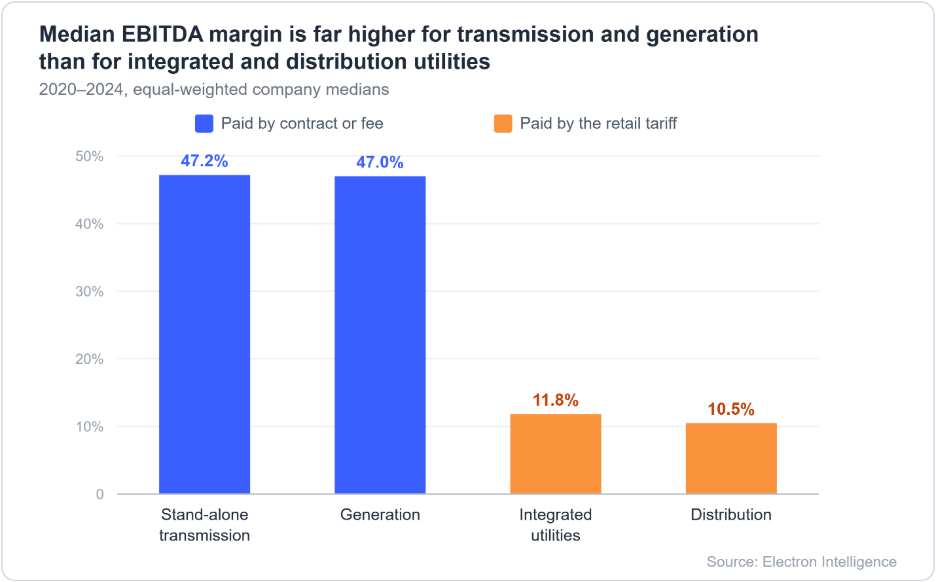
Fig 2: Median EBITDA margins were highest for stand-alone transmission and generation companies paid by contract or fee, and markedly lower for integrated utilities and distribution companies paid by the retail tariff.
Each business model converted infrastructure into revenue differently. Generation companies relied on electricity dispatch, contractual arrangements and plant utilisation to generate revenue. Transmission companies relied on regulated network revenues and the timely commissioning of new assets. Integrated utilities balanced multiple revenue streams across the electricity value chain but also managed a broader range of operational and regulatory risks.
The strongest financial performers generally operated business models that generated predictable revenue from existing infrastructure. TAQA Morocco combined high plant availability with long-term power purchase agreements that secured stable capacity payments, while debt refinancing lowered financing costs. HCB followed a similar approach. Its mature hydroelectric assets, stable demand and net cash position supported strong financial performance without requiring continuous investment in new generation capacity.
Other commercial models produced very different financial outcomes despite substantial infrastructure investment. Uganda’s UEGCL expanded generation capacity through the Isimba and Karuma hydropower projects, but energy-based billing, dispatch constraints and foreign-currency debt delayed the financial returns from those investments. KETRACO expanded Kenya's transmission network, but project delays, receivable build-up and arbitration costs slowed the conversion of new infrastructure into sustainable earnings. Commercial arrangements, rather than infrastructure alone, determined how effectively companies converted physical assets into revenue and cash flow.
Government ownership did not determine operating performance
State-linked companies matched or exceeded the operating performance of private-linked companies across several key metrics, indicating that ownership alone did not determine how effectively companies generated revenue or operating earnings from their assets. Revenue growth, EBITDA margins and operating cash generation remained broadly comparable across both groups, despite the common perception that government ownership inherently weakens financial performance.
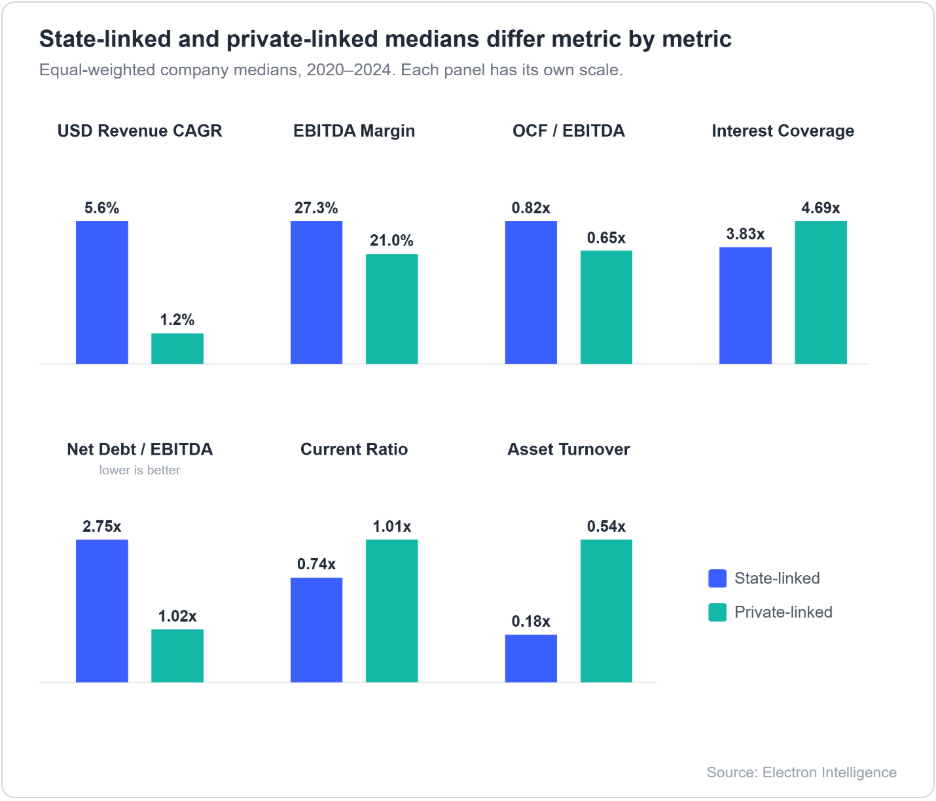
Fig 3: State-linked and private-linked companies posted similar EBITDA margins and cash conversion, but diverged sharply on leverage, liquidity and asset turnover.
The balance sheet reveals a different distinction. State-linked companies generally carried higher leverage, lower liquidity and lower asset turnover than their private-linked peers. Higher leverage, lower liquidity and weaker asset turnover created a different financial profile without materially weakening operating performance. Private linked companies generated comparable operating earnings but supported those earnings with larger capital bases, higher debt levels and less financial flexibility.
HCB illustrates this distinction. Despite state ownership, the company recorded one of the strongest operating performances in the dataset, supported by high operating margins, strong revenue growth and a net cash position. TAQA Morocco achieved similarly strong operating performance under private ownership, combining strong operating margins with robust interest coverage under a long-term contractual framework. Both companies generated strong operating results under different ownership structures because disciplined operations and stable commercial arrangements mattered more than ownership itself.
Companies separated themselves through capital structure and capital recovery rather than ownership. Capital invested, financing costs and capital recovery mechanisms shaped balance sheet strength more than ownership itself, explaining why the clearest differences between state-linked and private-linked companies appeared in leverage, liquidity and asset productivity rather than in their ability to generate revenue or operating earnings.
Ownership, therefore, should not be viewed in isolation. Commercial arrangements, capital structure and business model provide a more complete explanation of financial outcomes than whether a company is publicly or privately controlled.
Strong local-currency revenue growth did not always translate into stronger US dollar performance
Strong local-currency revenue growth did not produce the same commercial outcomes across the companies analysed. Several companies increased revenue rapidly in domestic currency between 2020 and 2024, yet those gains weakened considerably, or disappeared altogether, when measured in US dollars. The divergence appeared across the dataset but was most pronounced among the Nigerian companies, where the sharp depreciation of the naira fundamentally changed the relationship between reported revenue growth and underlying commercial performance.
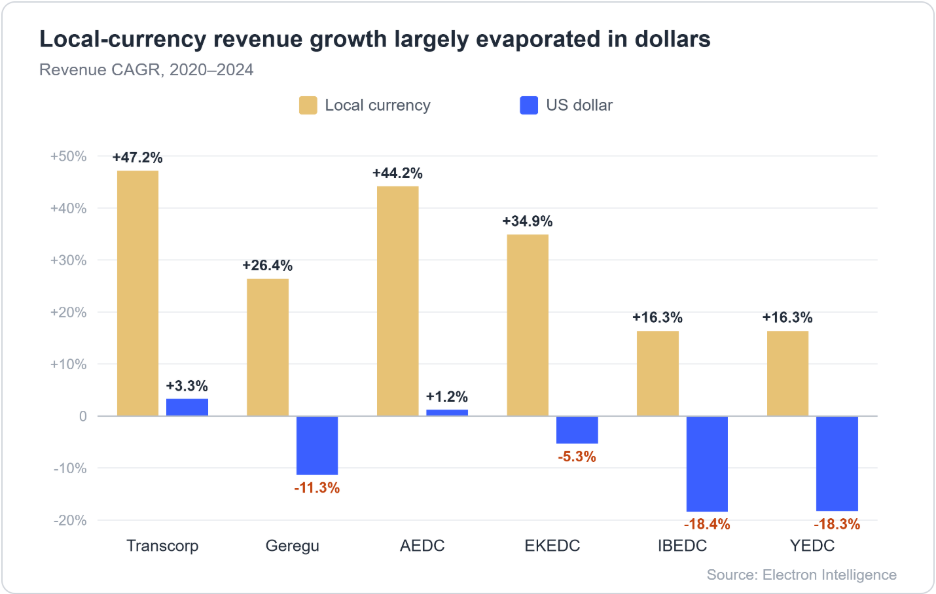
Fig 4: Local-currency revenue growth was strong across the Nigerian companies shown, but US dollar revenue growth was far weaker or negative for most, reflecting currency depreciation.
The results show that exchange-rate depreciation affected companies through different commercial channels rather than in a uniform way. Geregu Power illustrates how rising US dollar-linked gas costs, foreign exchange losses and tariffs that failed to keep pace with currency depreciation reduced the value created from strong local-currency revenue growth. Transcorp Power operated under the same macroeconomic conditions but preserved more value by expanding cross-border electricity sales, increasing bilateral contracts and eliminating its US dollar acquisition debt, reducing future foreign exchange exposure.
Distribution companies experienced a different challenge. EKEDC carried no material foreign-currency debt, yet currency depreciation still weakened financial performance because wholesale electricity costs increased much faster than regulated retail tariffs. Government tariff shortfall subsidies supported reported earnings, but they did not restore cost recovery or prevent the erosion of the company's underlying commercial position.
The comparison shows that exchange-rate depreciation alone did not determine financial outcomes. Revenue model, tariff design, foreign-currency exposure and commercial strategy shaped how effectively companies protected revenue and earnings as local currencies weakened. Looking at both local-currency and US dollar revenue therefore provides a clearer picture of commercial performance than either measure in isolation.
What We're Watching
The next phase will test whether companies can convert infrastructure into stronger commercial returns. Higher dispatch and more cost-reflective capacity payments could allow UEGCL to narrow the gap between asset growth and financial performance, while project commissioning and improved cash collection could do the same for KETRACO. If TAQA Morocco and HCB continue delivering strong returns without significant infrastructure expansion. The next phase will test whether today's performance gap reflects a temporary delay in monetising new infrastructure or a more durable advantage for companies operating mature, cash-generating assets.
Bottom Line
Financial performance across Africa's listed power sector depended less on the pace of infrastructure expansion than on the ability to convert existing assets into commercially recoverable revenue. Companies that combined strong revenue productivity with supportive commercial arrangements, disciplined capital structures and resilient revenue streams consistently generated stronger financial outcomes than those whose infrastructure expanded faster than their commercial returns. As new investment enters the sector, the critical question is no longer how much infrastructure companies build, but how effectively they monetise it.